Eurorack Power Distribution and Noise White Paper
version 1.03
Index
Audio and Video Frequency Range Results
Audio Waveform Results with a Quiet VCA/Mixer Module
Audio Spectrum Results with a Quiet VCA/Mixer Module
Audio Waveform and Spectrum Results with an OTA based VCA module
Audio Waveform and Spectrum Results with an Attenuverter plus DC Offset module
Combined results from Veils, VCA and Attenuverter
Can switching power supply noise be filtered out with a bus board?
Resistance Measurements
What is the resistance of ribbon cables, connectors, common bus boards and common wire sizes?
How do you measure resistances as low as fractions of a milliohm?
Introduction
This is the Eurorack Power Distribution White Paper, answering noise and power distribution questions for eurorack modular synthesizer systems. Various solutions are examined and compared for actual results through example oscilloscope and 24 bit DAW waveforms and graphics showing typical noise reduction levels. The material also covers practical examples and explains the theory behind noise coupling and its reduction.
Audio and Video Frequency Range Results
What are the real world audio results comparing noise coupling between different power bus solutions?
Audio Tests Introduction
This section shows the results of a controlled experiment with eurorack power distribution and the audio frequency noise that propagates through the system. Four different power distribution methods are analyzed using three different output modules to show how those will also change the system noise floor.
The four power distribution methods are the flying bus cable, a 1 ounce copper (2 layer) passive bus "strip" board with some capacitors and vertical headers, a 4 ounce copper (2 layer) passive bus "strip" board with vertical headers, and the Genus Modu Low Impedance Bus Board. The set up includes a standardized arrangement of modules for an equal comparison across the power bus solutions. Power connections are as similar as possible between the power distribution system tests to maintain a fair comparison. For descriptions of 1 ounce and 4 ounce copper see the topic What is the resistance of ribbon cables, connectors, common bus boards and common wire sizes? In general 4 ounce copper bus boards have 4 times the copper as 1 ounce copper boards.
As you will see in this section your system noise is determined by multiple factors including the noise generated from your modules and power supply, the power distribution of your system, and the characteristics of the output module and how it couples to the noise. More information on how noise propagates in a system is available in the Theory section of this white paper.
Before going through the complicated test setup and results section, an overall comparison of data is provided here. The tables below compare specific spectrum plot frequencies across the power distribution and output module combinations. As can be seen there are some wide variations in results, which will be explained in more detail in the audio test result subsections. Generalizing from the data, the noise level for the solutions is ranked from highest for the first one (FBC) to lowest for the last one (LIBB).
Table for FFT Results, 240 Hz
|
Power Distribution Solution |
Veils 240 Hz (dB) |
Veils 240 Hz Improvement over FBC |
OTA VCA 240 Hz (dB) |
OTA VCA 240 Hz Improvement over FBC |
Attenuverter 240 Hz (dB) |
Attenuverter 240 Hz Improvement over FBC |
|---|---|---|---|---|---|---|
|
FBC |
-108 |
- |
-98 |
- |
-80 |
- |
|
1ozBB |
-125 |
7.1 times |
-97 |
worse |
-84 |
1.6 times |
|
4ozBB |
-128 |
10.0 times |
-104 |
2.0 times |
-88 |
2.5 times |
|
LIBB |
<-144 |
> 63 times |
-107 |
2.8 times |
-90 |
3.2 times |
Table for FFT Results, 1.2 KHz
|
Power Distribution Solution |
Veils 1.2 KHz (dB) |
Veils 1.2 KHz Improvement over FBC |
OTA VCA 1.2 KHz (dB) |
OTA VCA 1.2 KHz Improvement over FBC |
Attenuverter 1.2 KHz (dB) |
Attenuverter 1.2 KHz Improvement over FBC |
|---|---|---|---|---|---|---|
|
FBC |
-121 |
- |
-119 |
- |
-95 |
- |
|
1ozBB |
-137 |
6.3 times |
-119 |
same |
-100 |
1.8 times |
|
4ozBB |
-133 |
4.0 times |
-122 |
1.4 times |
-102 |
2.2 times |
|
LIBB |
-138 |
7.1 times |
-127 |
2.5 times |
-108 |
4.5 times |
Table for FFT Results, 16 KHz
|
Power Distribution Solution |
Veils 16 KHz (dB) |
Veils 16 KHz Improvement over FBC |
OTA VCA 16 KHz (dB) |
OTA VCA 16 KHz Improvement over FBC |
Attenuverter 16 KHz (dB) |
Attenuverter 16 KHz Improvement over FBC |
|
FBC |
-119 |
- |
-116 |
- |
-95 |
- |
|
1ozBB |
-120 |
1.1 times |
-119 |
1.4 times |
-94 |
worse |
|
4ozBB |
-122 |
1.4 times |
-123 |
2.2 times |
-93 |
worse |
|
LIBB |
-131 |
4.0 times |
-138 |
12.6 times |
-107 |
4.0 times |
Audio Test Setup
The goal of this test is to capture the audio from the eurorack system exactly as you would see it in your own recordings. The eurorack audio output is sent to a 24 bit recording set up and captured for analysis.
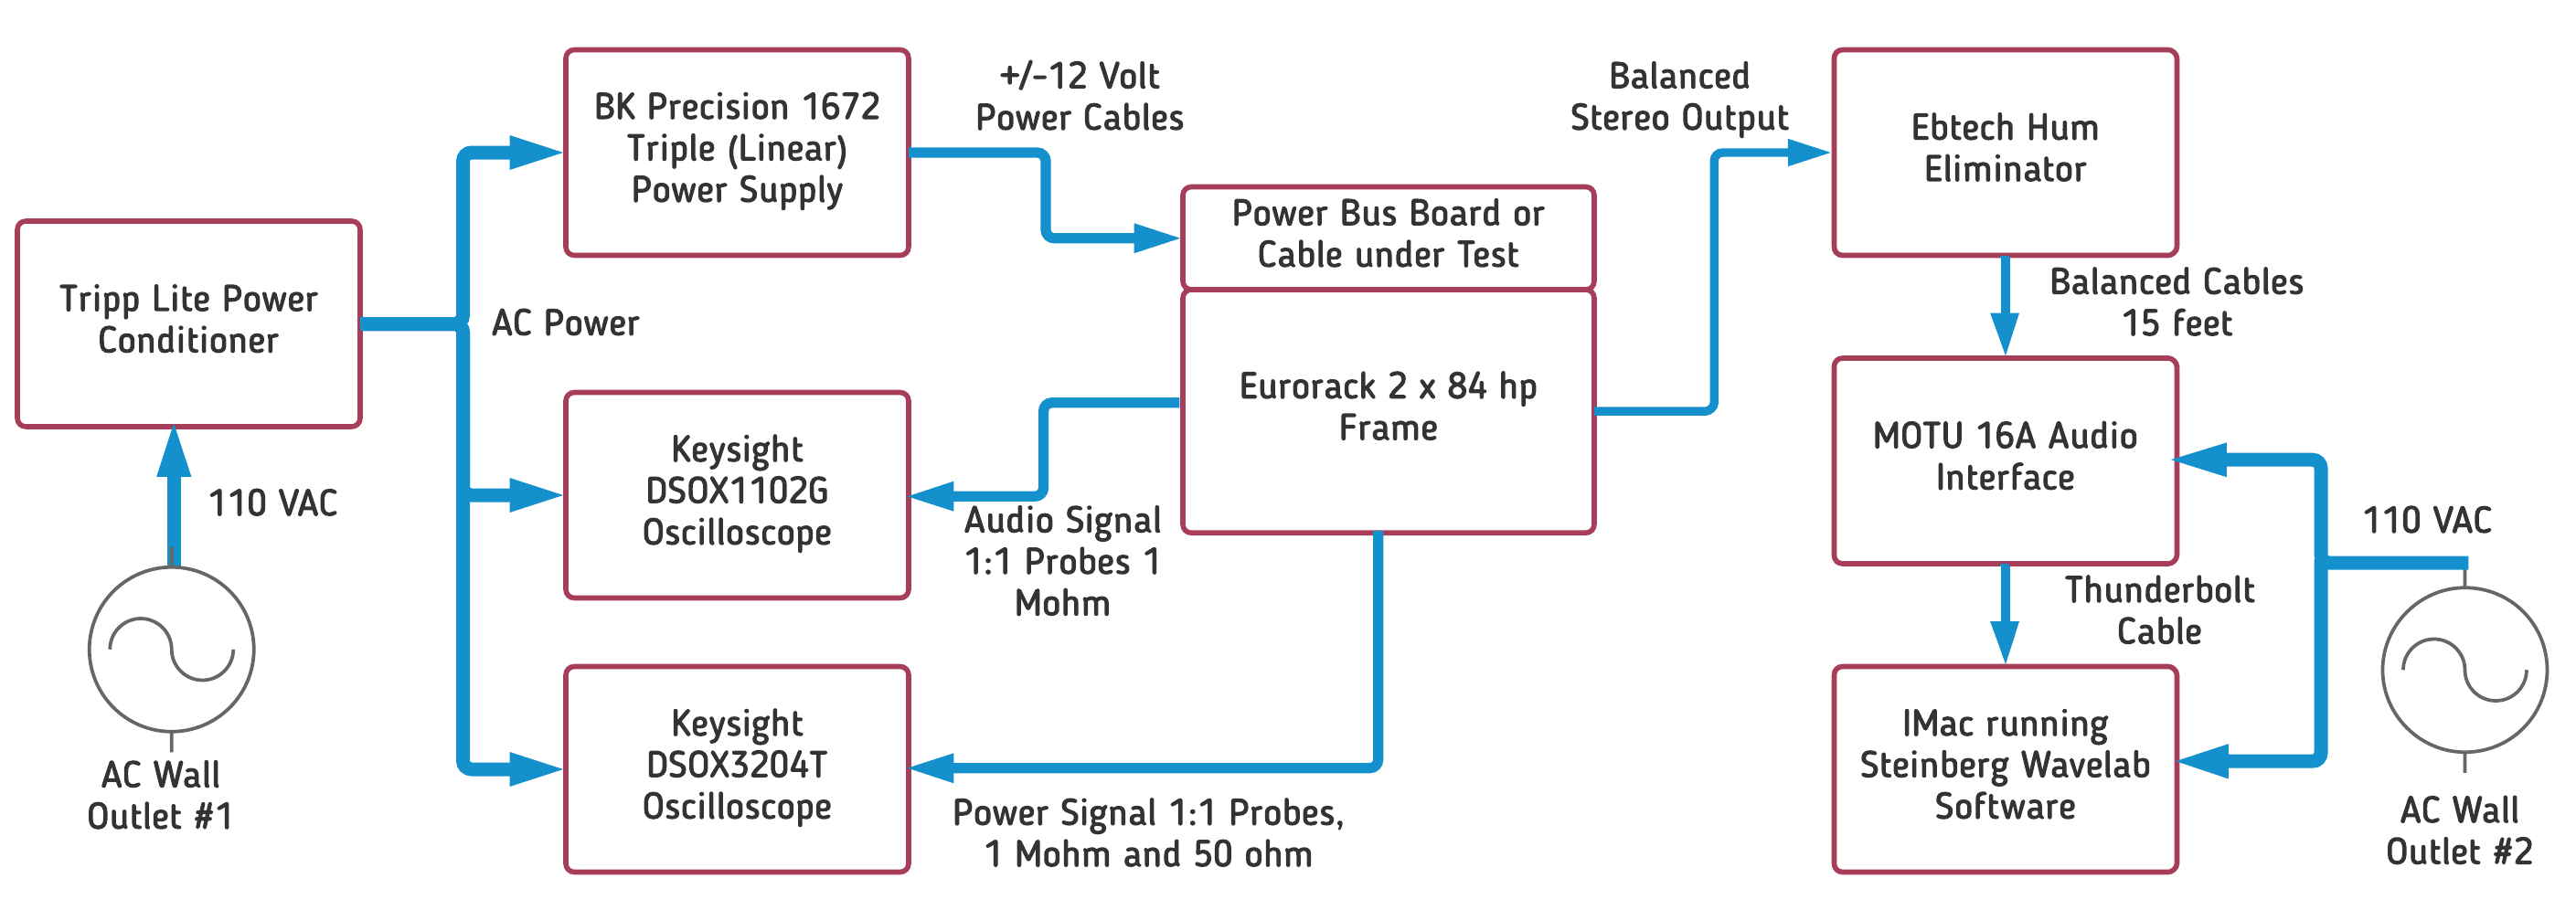
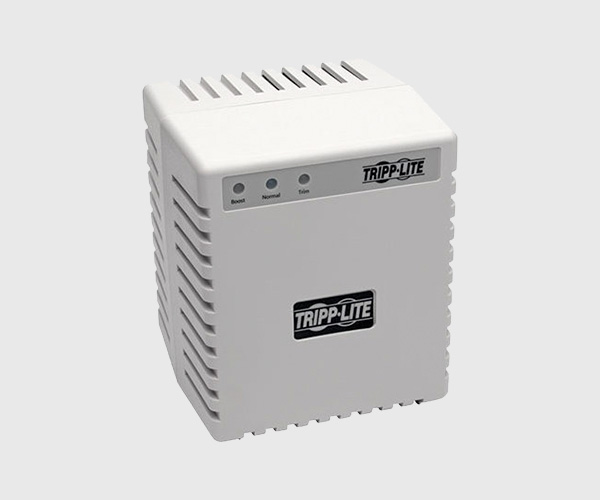
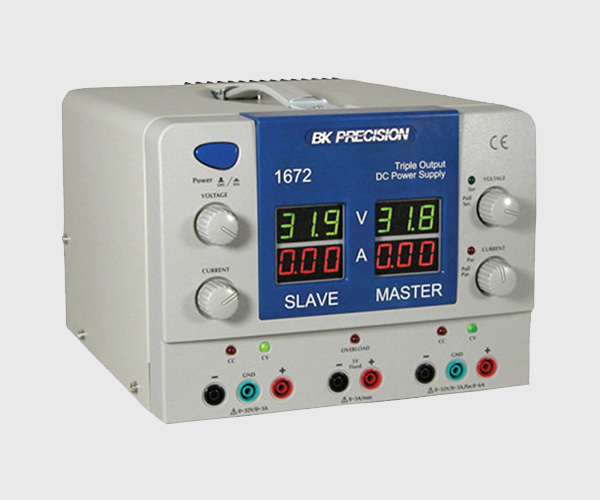
The eurorack power supply and the oscilloscopes are powered through a Tripp Lite power conditioner to reduce any spurious AC noise from entering the test setup. The power supply used is a bench power supply with very low AC noise better than one millivolt RMS. It is a BK Precision 1672 Triple Output Power Supply and is quieter than nearly any linear power supply you would buy for your modular cabinet. The set up uses +/-12 volts from the power supply to power the eurorack modules. Other power supplies could show worse results. The high specification bench power supply was chosen to reduce dependencies of any particular power supply and to focus on the interaction between modules and their shared power connection under the best possible circumstances.
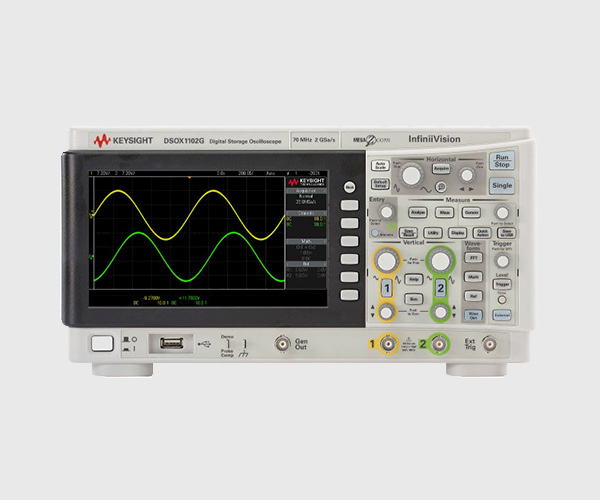
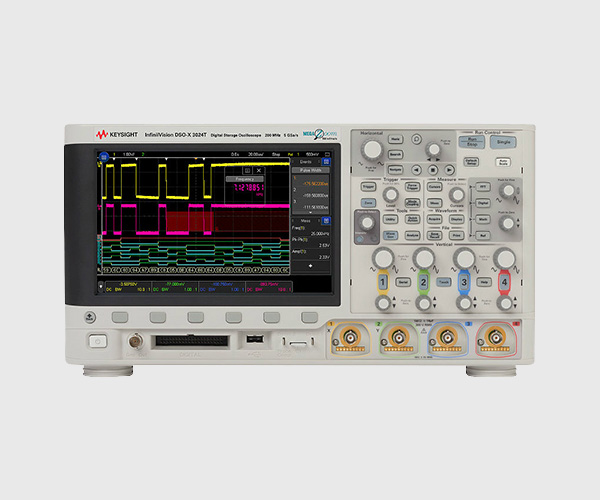
The two Keysight oscilloscopes are used to capture audio and power signals from the eurorack system while tests are being run. The power measurement uses two signal probes connected as close as possible to the euro header connectors. One is a 1 Mohm 1:1 probe which is post processed to low pass filter frequencies above 1 KHz. The other is a 50 ohm 1:1 probe through a 50 ohm DC block with a 1 KHz high pass filter response. These are mathematically combined in the scope to provide an accurate composite image of the power bus noise over the frequency range, up to the standard bandwidth limit of 20 MHz.
For this test the euro rack modules are cabled with the normal euro header type connectors to the bus boards, with most cables being the standard 9-10 inches in length.
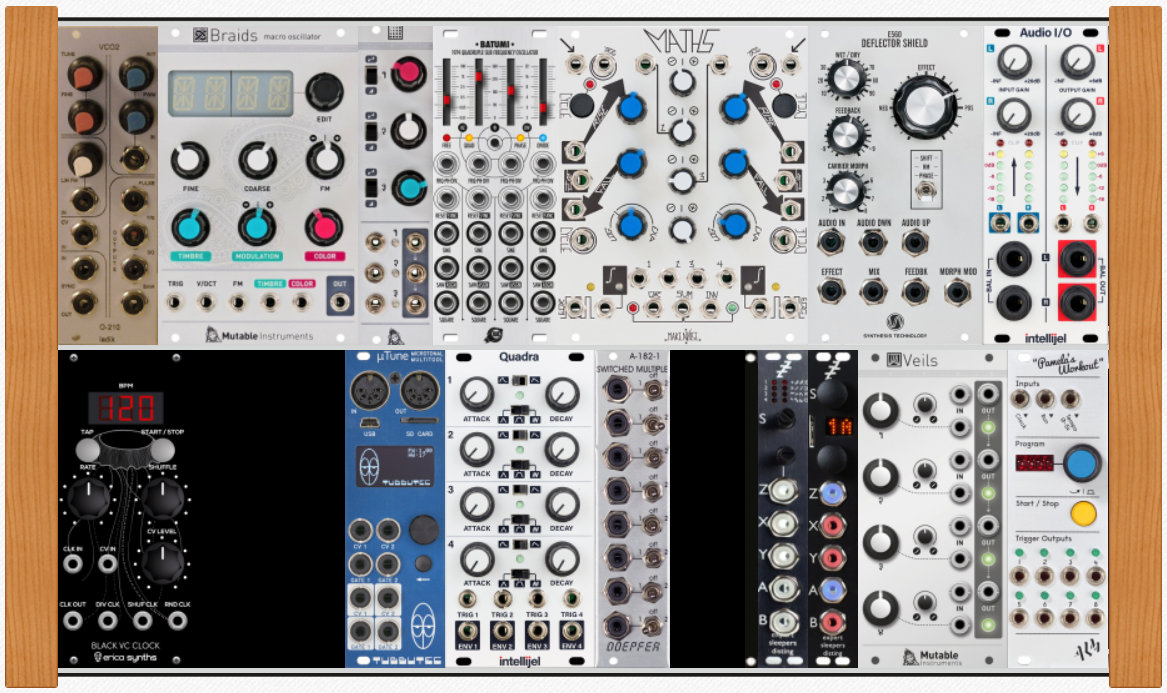
The image here shows the configuration of the modules. It is a modest 6U x 84 hp system. As you can see there are some of the most common modules for eurorack in the setup. Nearly every module contributes noise. Two modules are not shown, a VCA and an attenuverter module, which will be used as output modules.
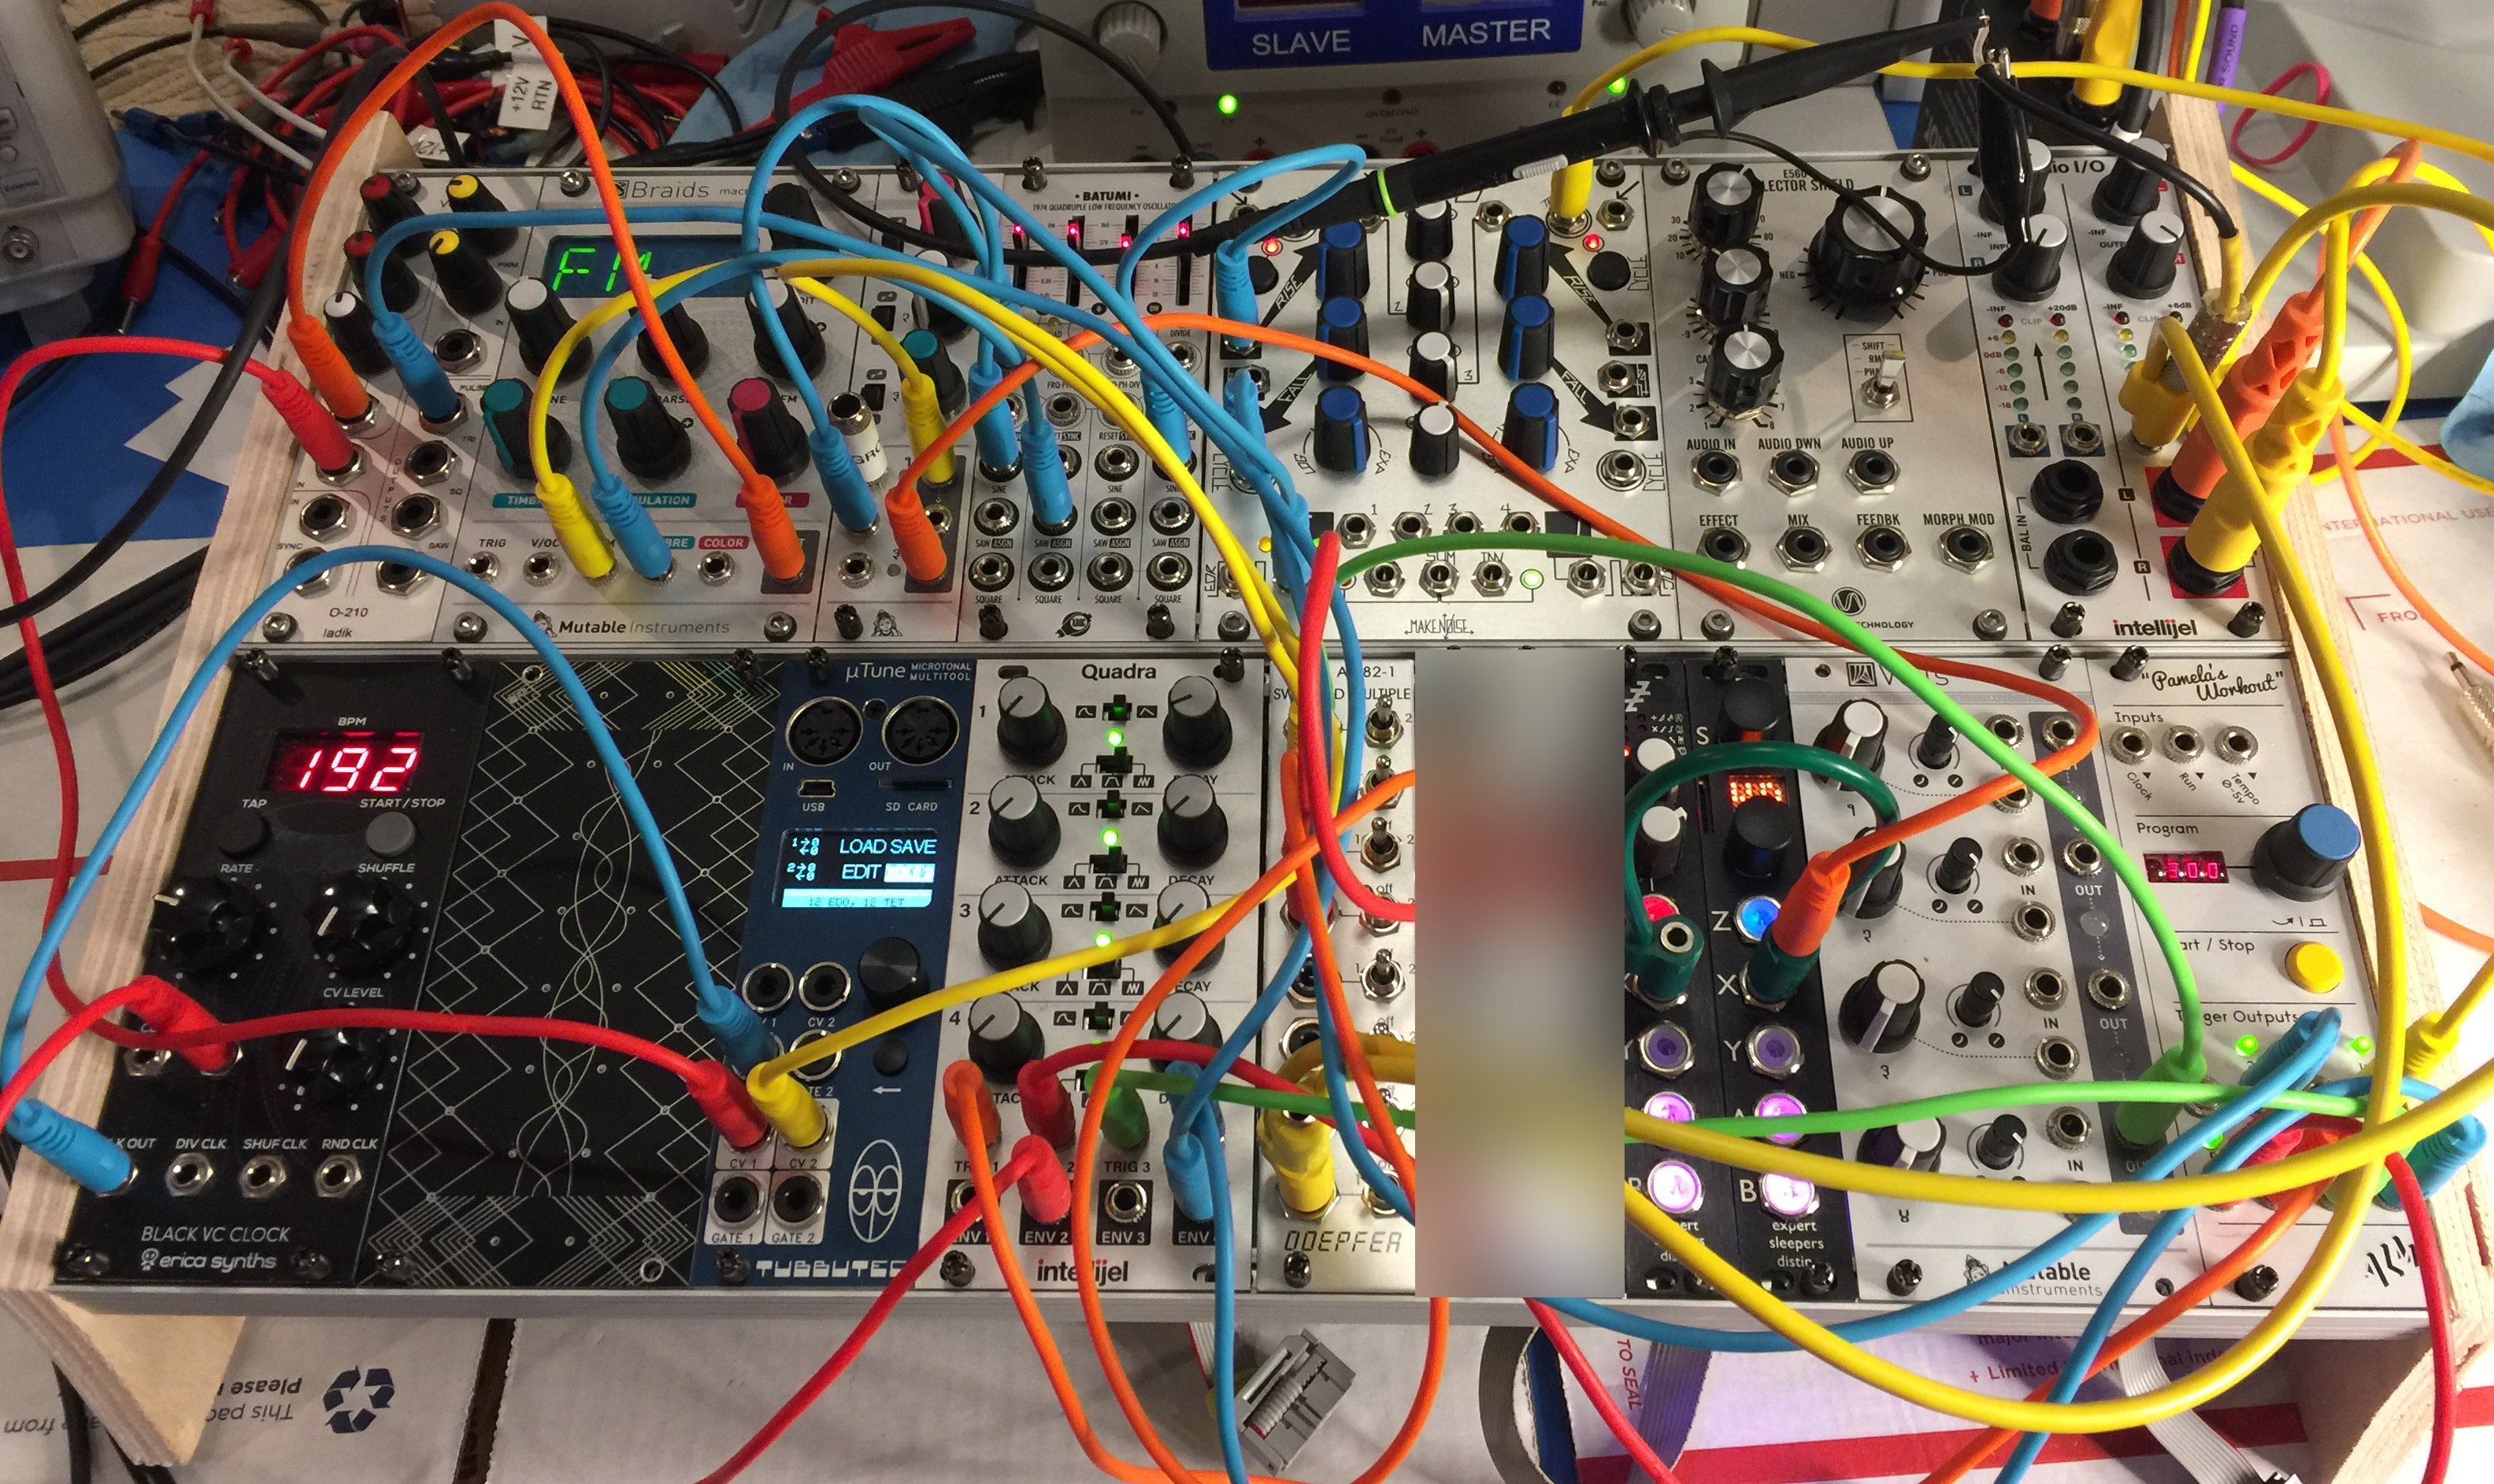
This system was also patched while running the test and modules were cycling or running as trigger generators, LFOs or VCOs to generate the noise, so any patch cord noise is included in these measurements. One module was pulsing eight LEDs at 240 Hertz, generating a good amount of noise including harmonics. The amount of power noise in the sample system is possibly higher than an average system, but there are many individual harmonics created by different modules that are nearly as high in amplitude.
Two of the modules are blank or blurred out in the image in the photograph. These are the two output modules showing less than optimal noise characteristics. The reason behind those characteristics will be described with the results. The purpose of these tests is not to criticize any specific module, it is to show the differences between different types of module designs that exist in a eurorack system. Each of the three output modules represents a large number of Eurorack module designs. As we will see, there is a wide variation in the noise output of these modules.
The default output test module is a Mutable Instruments Veils which is a 4 VCA summing mixer. There are no inputs to the VCA. We are looking at the quiescent noise floor of the module within the system configuration. The noise floor for the Veils VCA is typical of what you will see for a quieter output module.
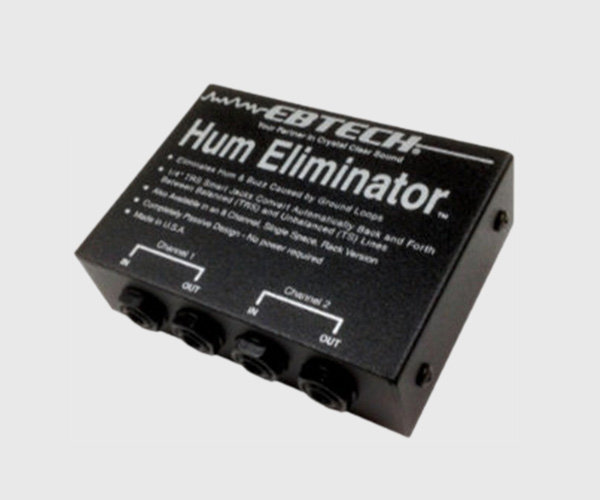
The output from the eurorack system is taken from an Intellijel Balanced I/O module. Short 1/4 inch balanced cables connect to the Ebtech Hum Eliminator. The Hum Eliminator is used to eliminate some of the AC noise generated by having a long 5 meter cable connected to the MOTU 16A audio interface, and by having the euro system powered through a different AC wall outlet than the computer and audio interface. The MOTU 16A interface connects to an iMac through a Thunderbolt cable where Wavelab software captures and displays the results.
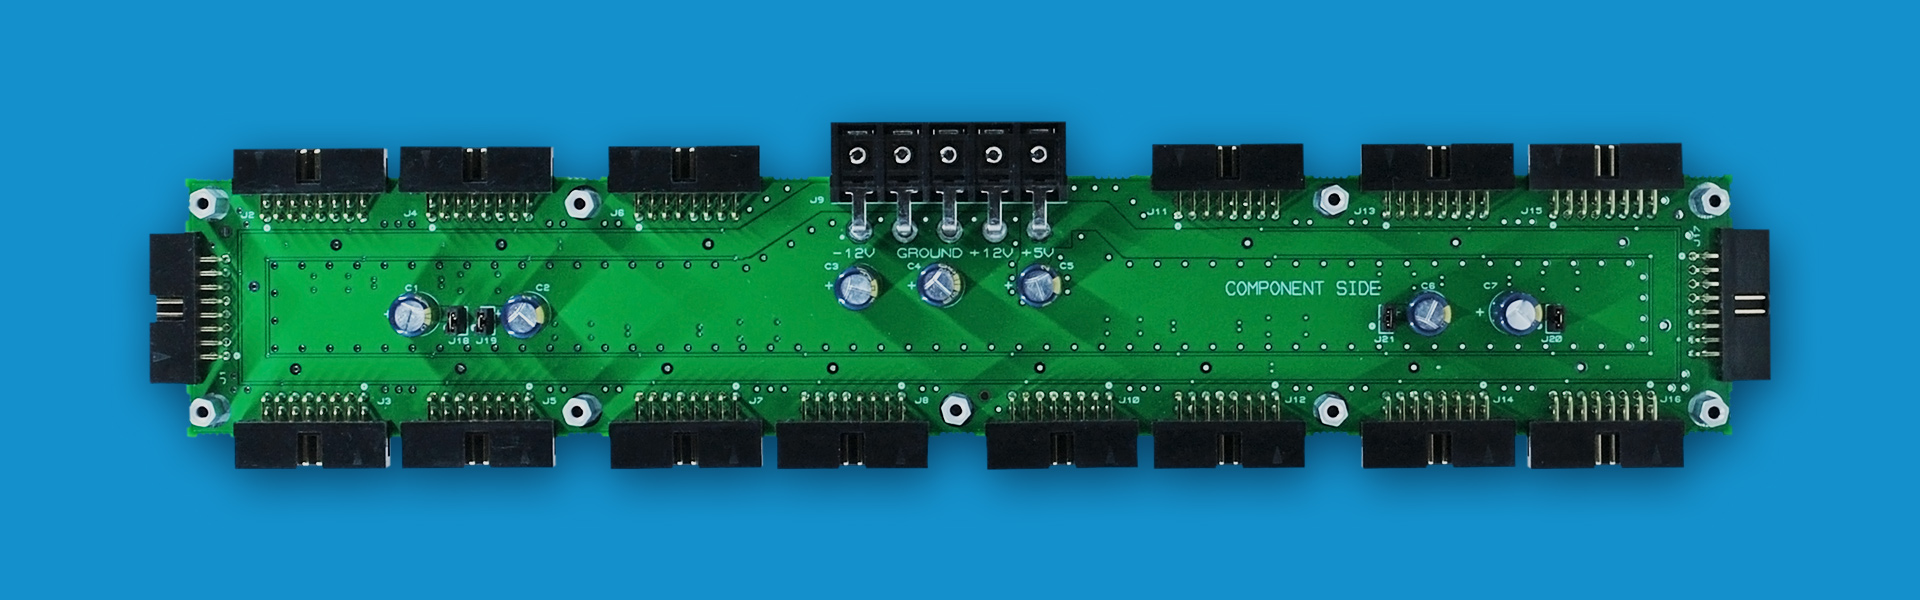
The block diagram here shows the configuration of the four different passive bus boards and bus cables used for these tests.
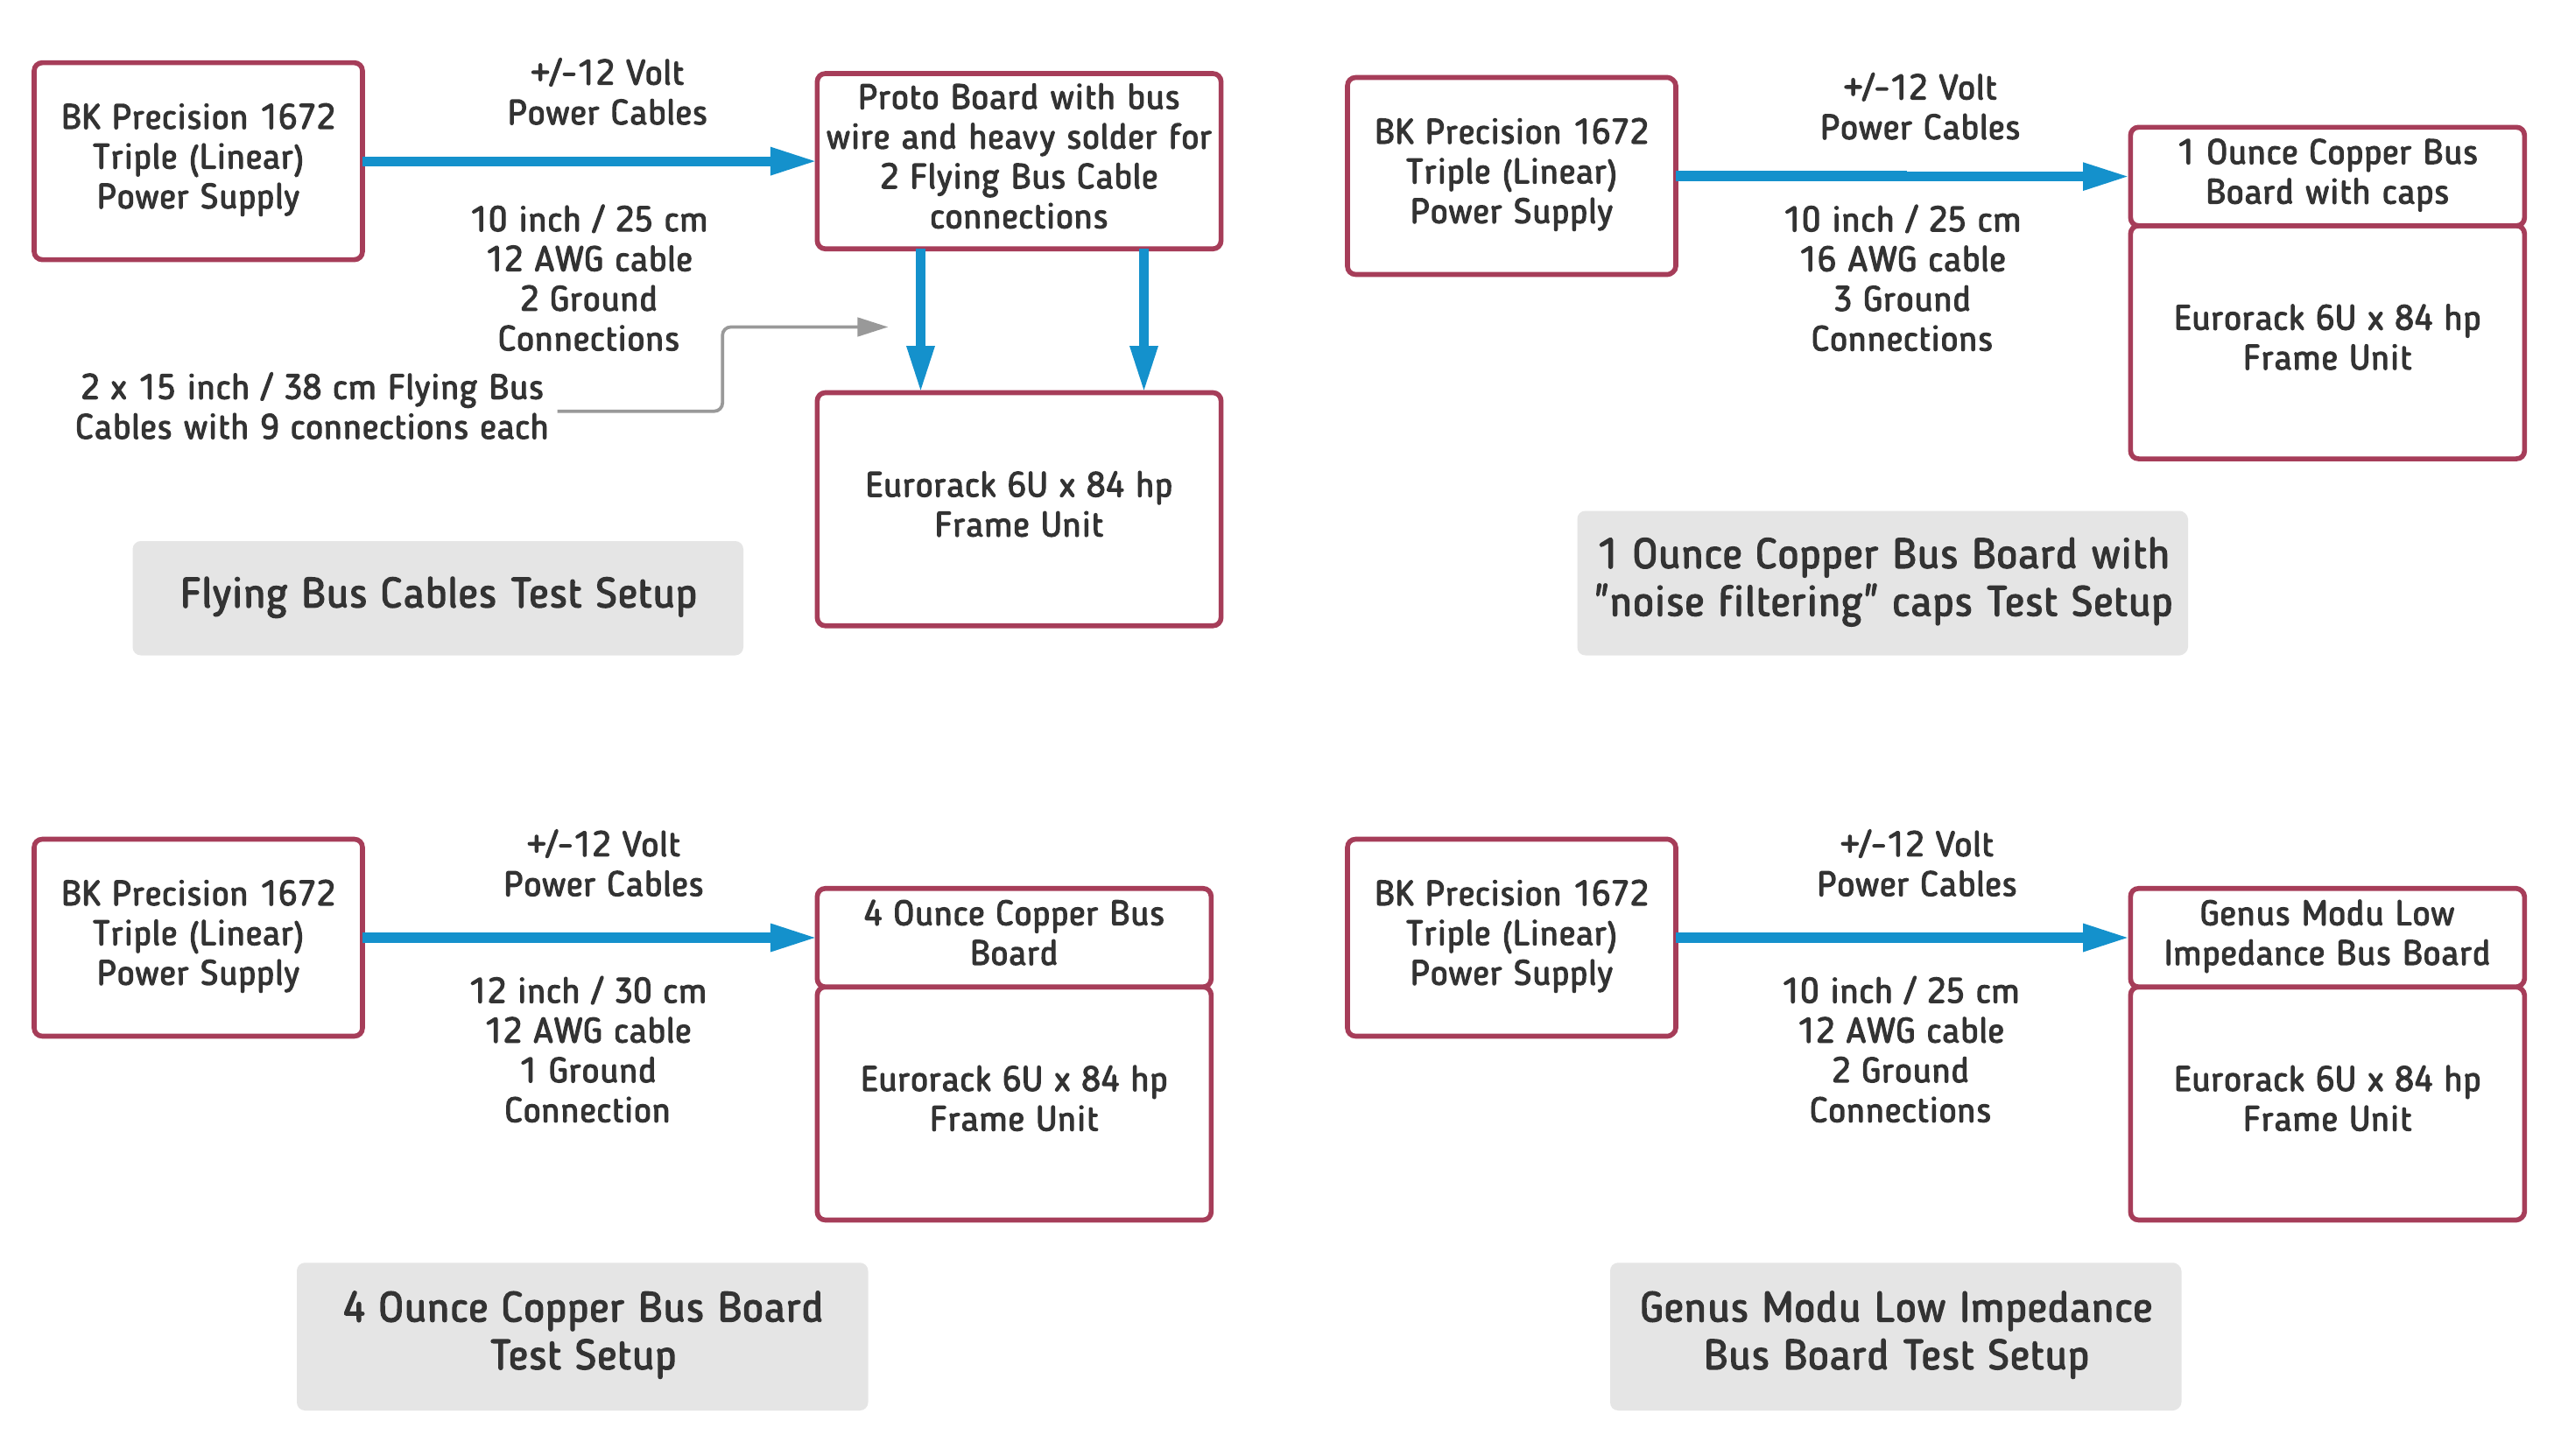
For the flying bus cables test setup the shortest and heaviest gauge wire possible was used to connect to a Proto board with bus wires and heavy solder to replicate a system with flying bus cables connected 4 HP power module. From this Proto board two 15 inch long ribbon cables were connected, each with nine power connectors on them. The ribbon cable was standard 28 AWG with six wires per ground and two wires per power rail per the eurorack standard. This build up was intended to mimic a power module with two flying bus cables attached. There is some advantage for this setup since power and ground paths are separated into two segments. One of the segments contained seven of the noisiest modules and the two probe points, either output modules or power measurements. Even so we’ll see this advantage was not enough to help reduce noise on the flying bus cables.
The 1 ounce copper bus board test set up uses a 10 inch cable with 16 gauge wires and three ground connections going to the bus board. The text shows “noise filtering caps” in parentheses as these capacitors do nothing for audio frequency noise and can increase switching power supply noise in the video frequency range. See the switching power supply noise section for more information.
For the 4 ounce copper bus board test 12 gauge cables were used which were much better than the default connection for this bus board. The connector design for the bus board has only one ground connection.
The Genus Modu Low Impedance Bus Board test setup uses 10 inch cables at 12 gauge size. These tests use two ground connections which are not the maximum for this bus board. You could actually connect four ground connections for even greater improvement in noise, particularly for long cable runs.
Information on cable and bus board resistances is provided in the section What is the resistance of ribbon cables, connectors, common bus boards and common wire sizes?
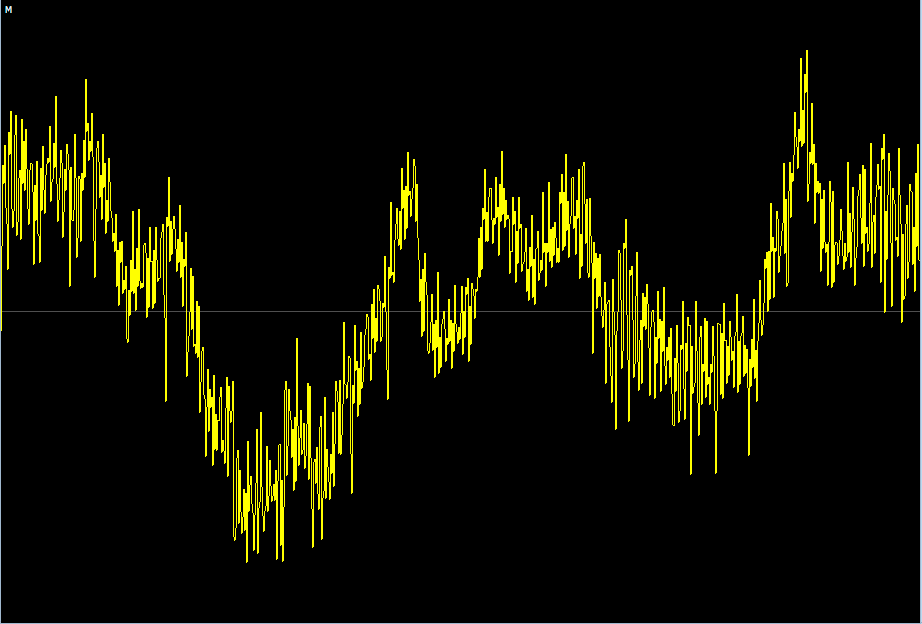
The theory behind low impedance bus board design is covered in the section What is ESR, |Z|, |Z| vs. Frequency and PDN? Throughout this section the following colors and abbreviations are used for the audio waveform and spectrum images:- Yellow – Flying Bus Cables = FBC
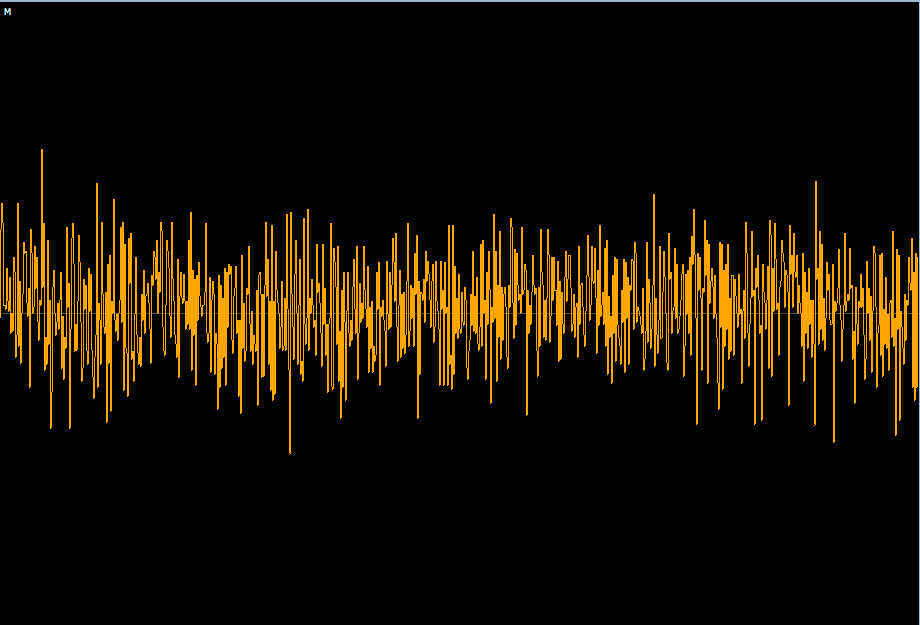
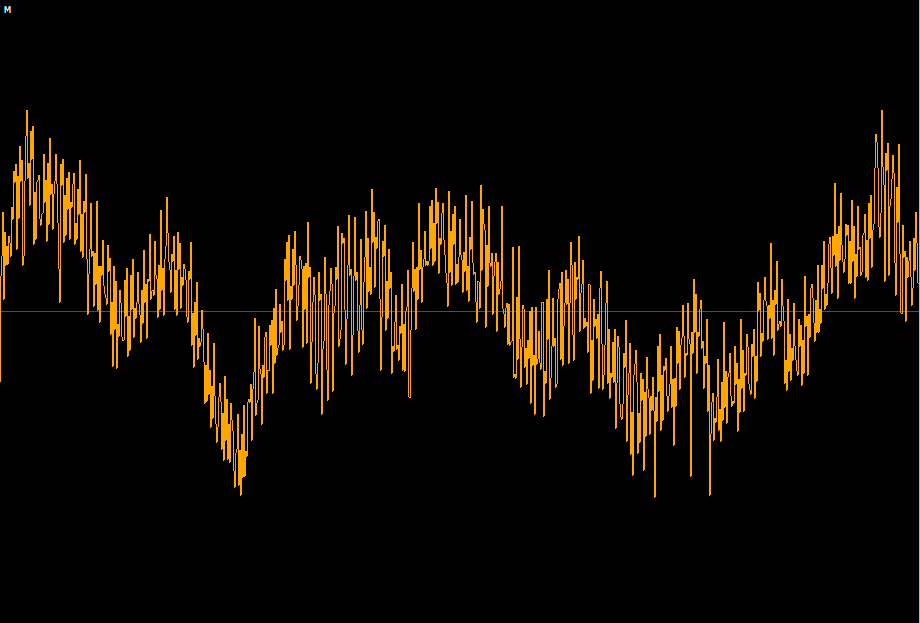
- Orange – 1 Ounce Copper Bus Board with capacitors = 1ozBB
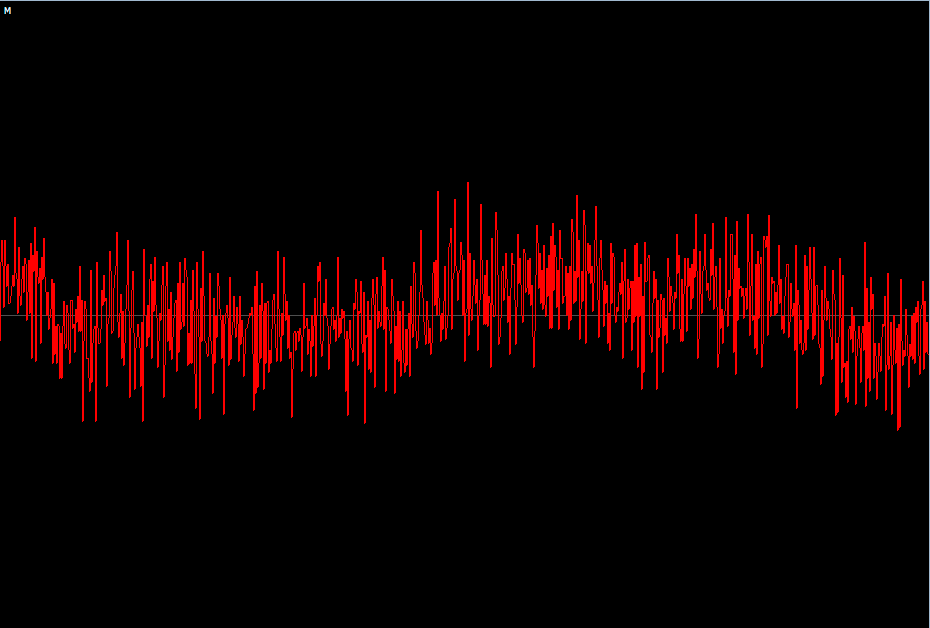
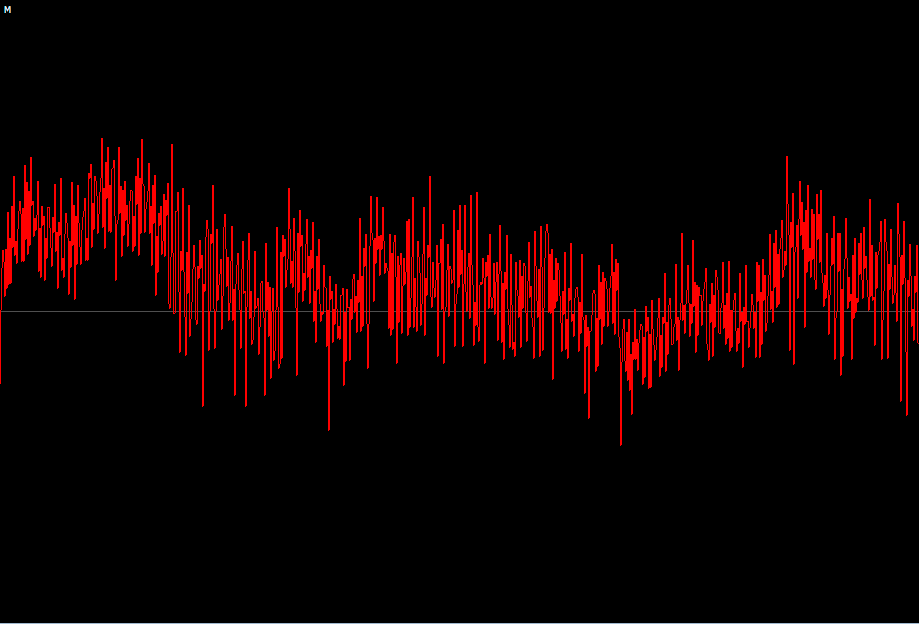
- Red – 4 Ounce Copper Bus Board = 4ozBB
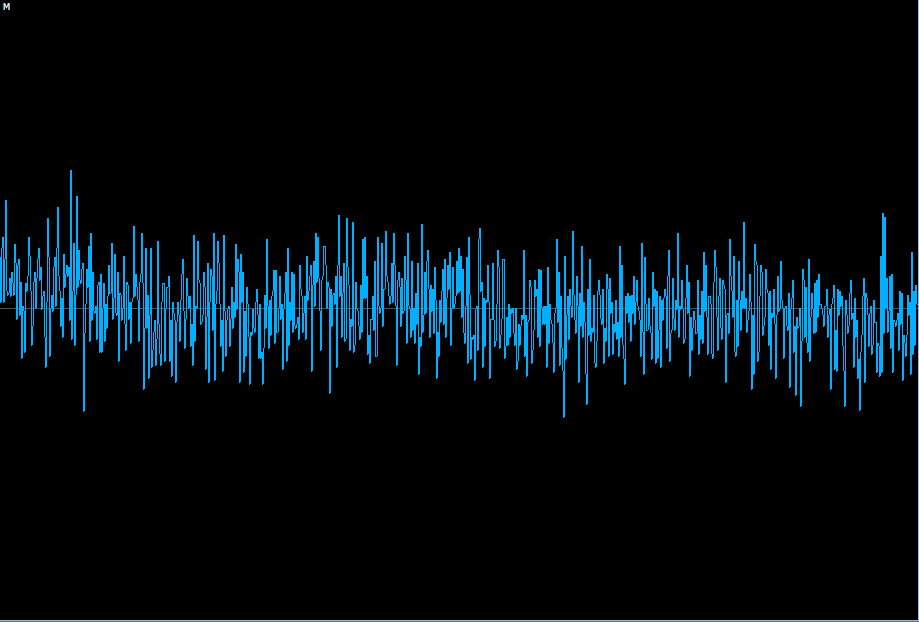
- Blue – Genus Modu Low Impedance Bus Board = LIBB
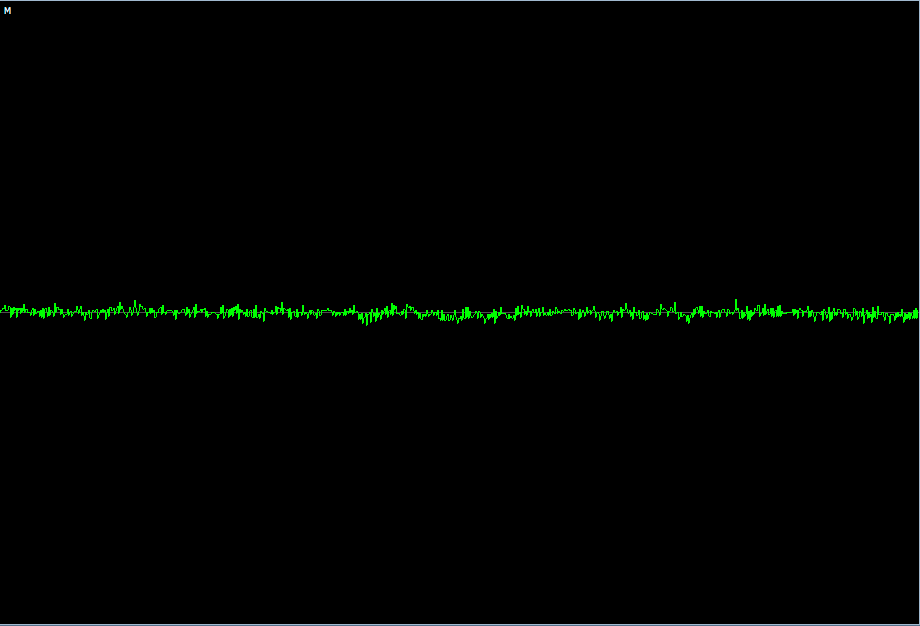
- Green – Kurzweil K2500RS KDFX and TC Electronic M300 output results
Audio Waveform Results with a Quiet VCA/Mixer Module
In this test setup we’ll use a bench power supply that is quieter than almost any commercial linear power supply. We also start with the quietest VCA/Mixer module we could find. The purpose is to show a best case example of inter-module noise coupling for each of the power solutions. Even in this case the differences will be noticeable. The power supply ripple specification is the greatest limiting factor once you get to the cleanest solution.
Since there is only one bus board and direct connection to the power supply, we’ll see the smallest differences between the power solutions with this setup. A larger 4 row 12U system or greater will start multiplying noise. This is because light gauge wires and daisy chained bus boards are typically wired in those systems. There is a subsection on building star power distribution that goes hand in hand with the lower noise solutions as the system size grows. Follow those and you’ll see an even greater improvement than is shown here.
Before showing the results from the Eurorack modular system, let’s show some noise prints of professional synthesizer and effects in the studio to establish a baseline. The equipment is a Kurzweil K2500RS synthesizer with KDFX effects from 1995 and a TC Electronic M300 digital effects unit from 2002. These units have balanced outputs though neither one specifies the noise levels.
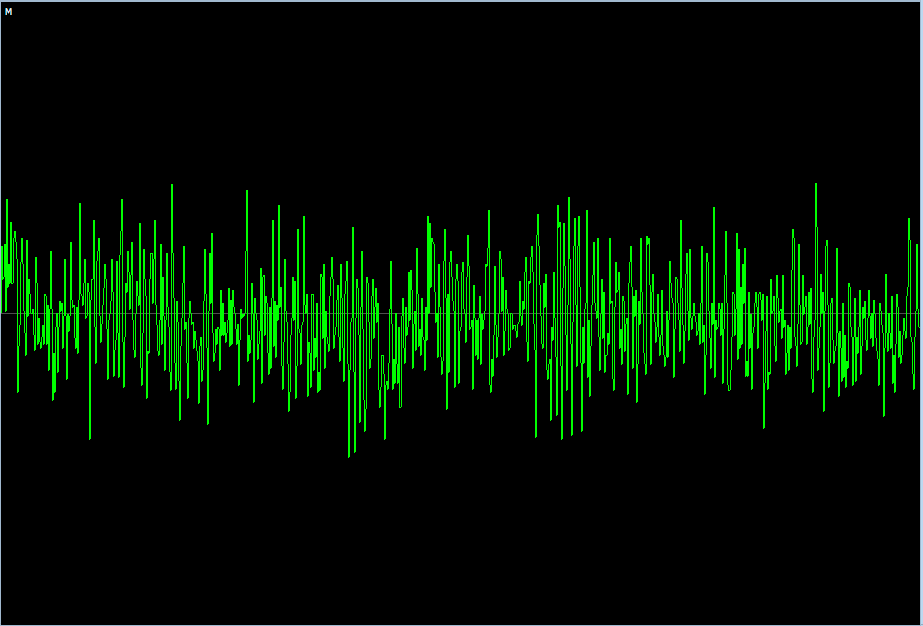
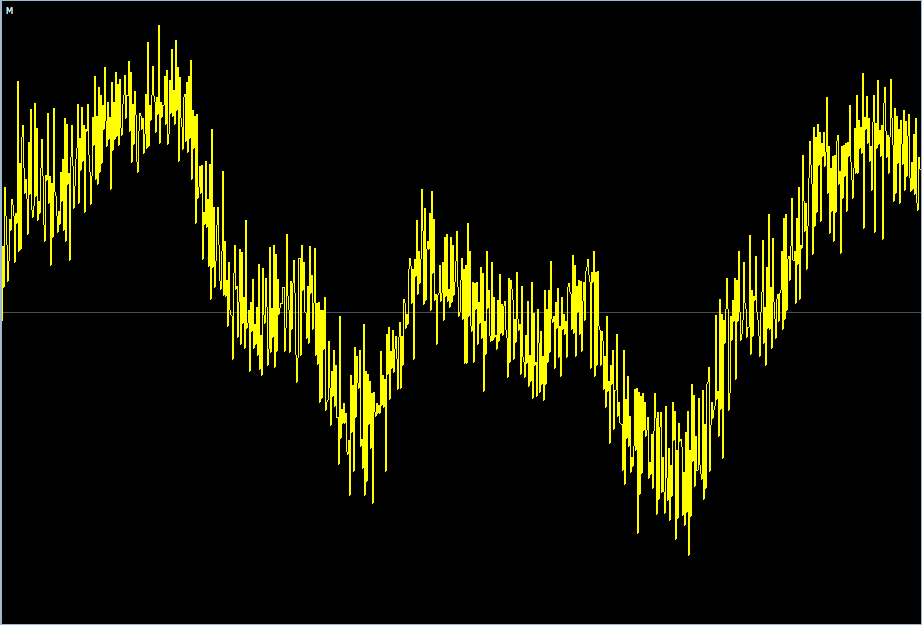
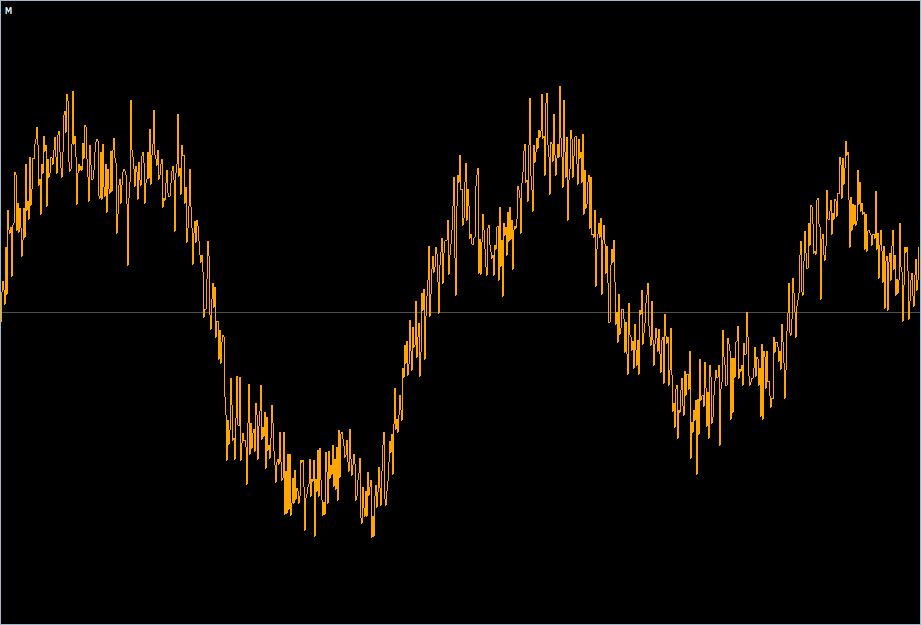
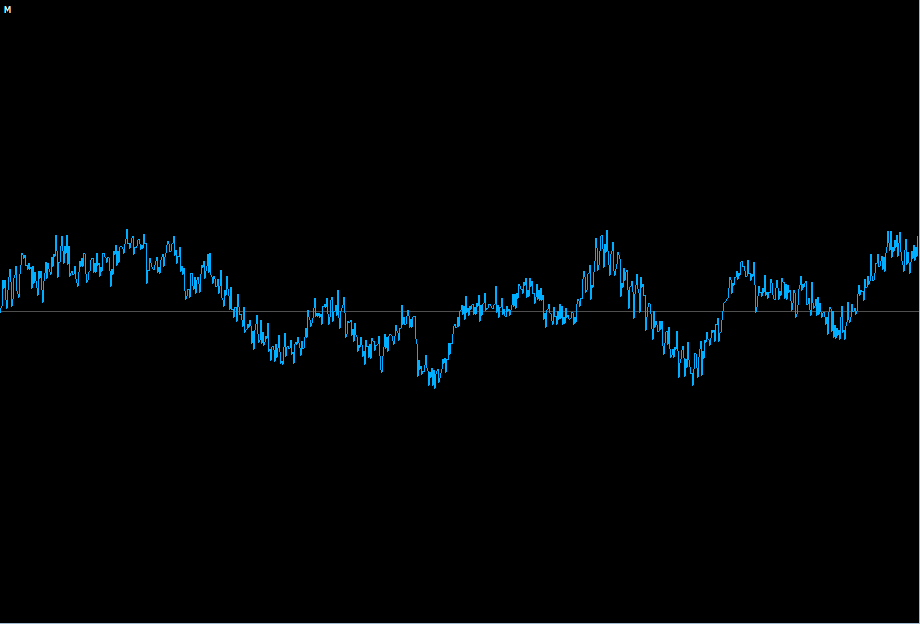
All waveforms in this section are amplified by +94 dB to approach full scale for the worse case waveform, allowing a visual comparison of the noise levels. These are “oscilloscope” type waveforms captured in Wavelab. The x axis is time and the y axis is amplitude. The following sections scale the waveforms to new amplitudes for the best comparison across the results.
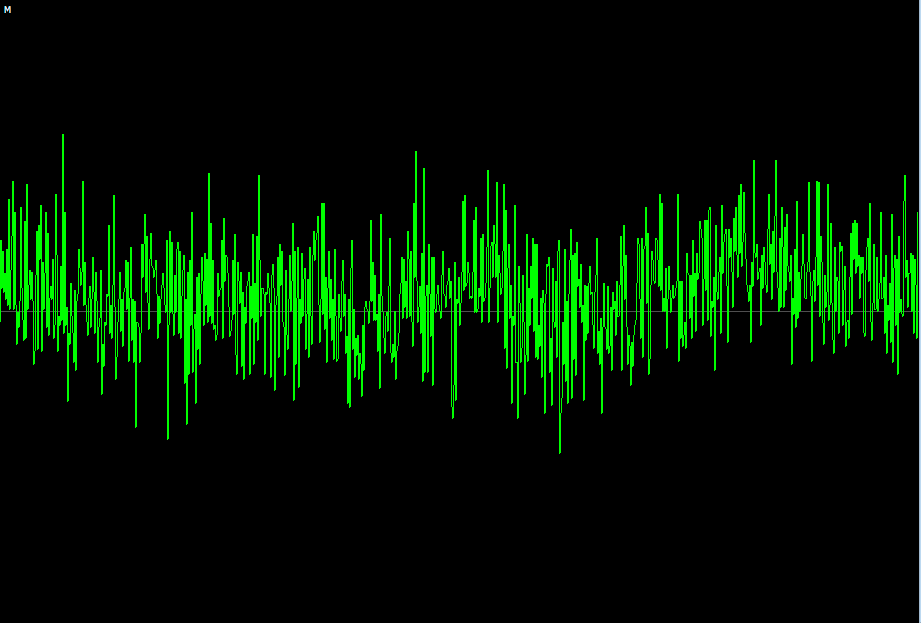

The K2500RS and M300 waveforms show similar results in signal amplitude. The following section with the spectrum comparison will show some differences.
The modular tests use a “clean” output module, a Mutable Instruments Veils VCA/Mixer. The Veils module design uses 2164 VCA chips and low noise TI/Burr Brown OPA1654 op amp. The 2164 VCA chips as specified from the original SSM design have a PSRR of 63 dB at 1 KHz and 35 dB at 20 KHz. The OPA1654 op amp has PSRR specified at 90 dB at 1 KHz declining to 66 dB at 20 KHz. PSRR is Power Supply Rejection Ratio, and is the ability of the device to reject AC frequencies seen at its power pins. The dB scale reflects a x10 factor for every 20 dB. The lowest PSRR of 35 dB is a 56 times reduction in AC noise, while the highest PSRR at 90 dB is a 31,623 times reduction in noise. The Veils design also uses an LM4040 voltage reference for all DC offset voltages, isolating power supply noise from summing nodes of the VCAs or op amps. All four Veils VCAs are set to minimum amplitude, linear scaling, and the output mix of all four VCAs is taken from the final stage. The amount of noise seen at Veils output is similar to the noise seen on other “quiet” Eurorack modules.
With the Flying Bus Cable results we see the high noise level from that distribution system. The larger shape differences are from low frequencies around 500 Hertz and less, while the spikes are from higher frequencies. This result is obviously worse than the reference equipment.
With the 1 Ounce Copper Bus Board, results are better and similar to the reference equipment. The 4 Ounce Copper Bus Board also shows better results, though strangely has a worse response at lower frequencies than the 1 ounce board. This difference is not due to the capacitors on the 1 Ounce Copper Bus Board. The value of capacitors are too low to have any effect at these frequencies. The Low Impedance Bus Board shows the best results, a little bit better than the reference equipment. The reason for the small incremental improvement will be described after the spectrum plots, which will show some important frequency differences between the modules.
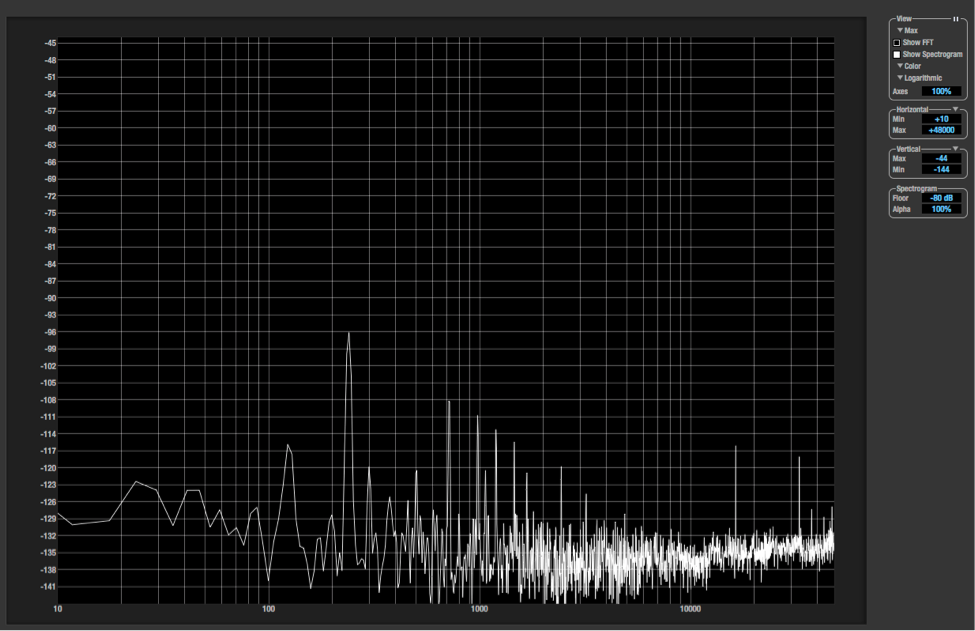
Audio Spectrum Results with a Quiet VCA/Mixer Module
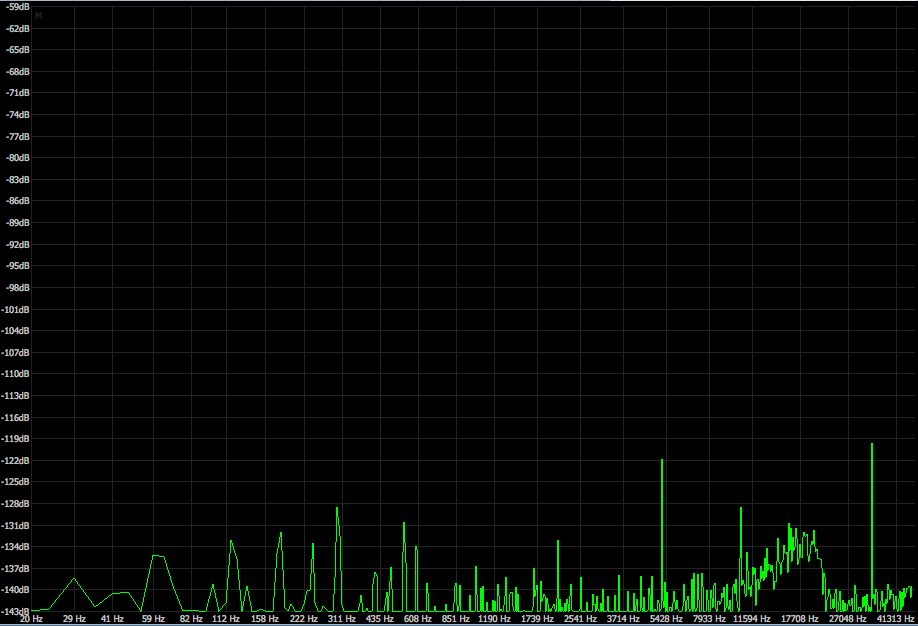
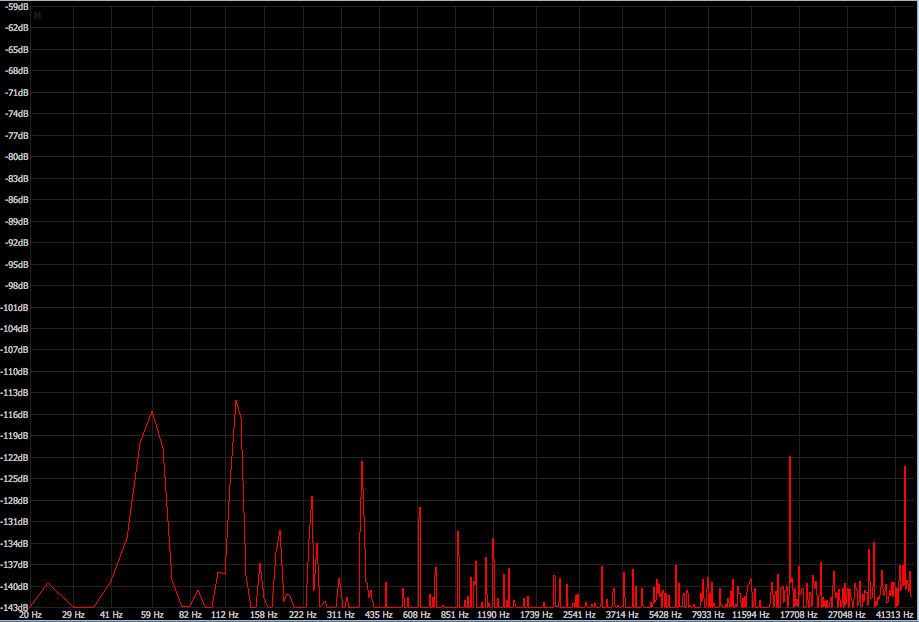
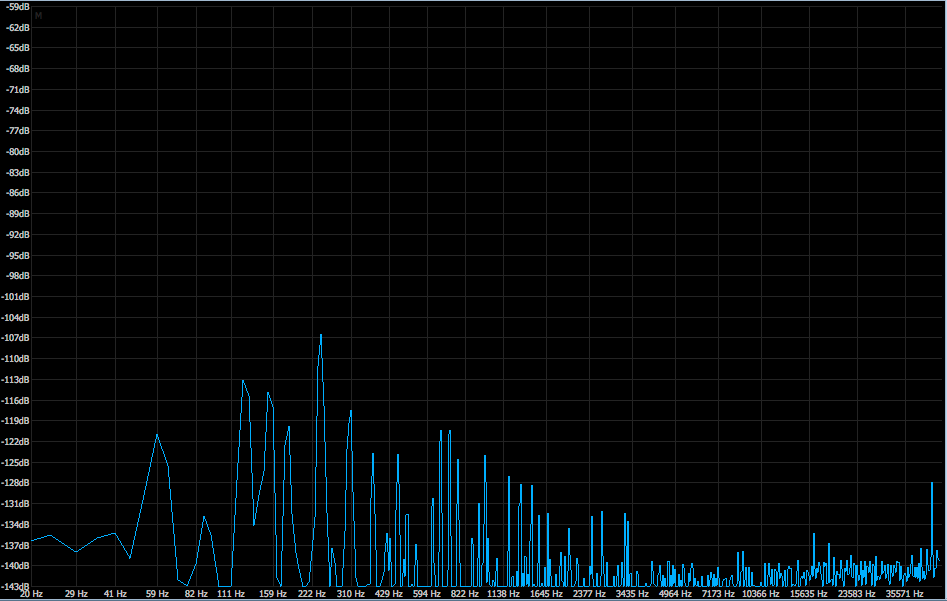
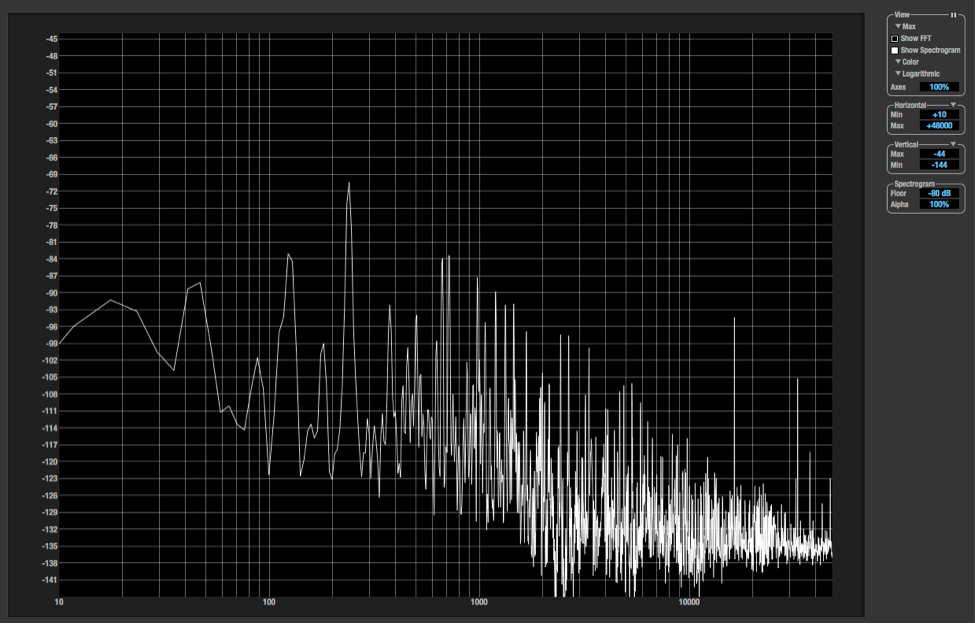
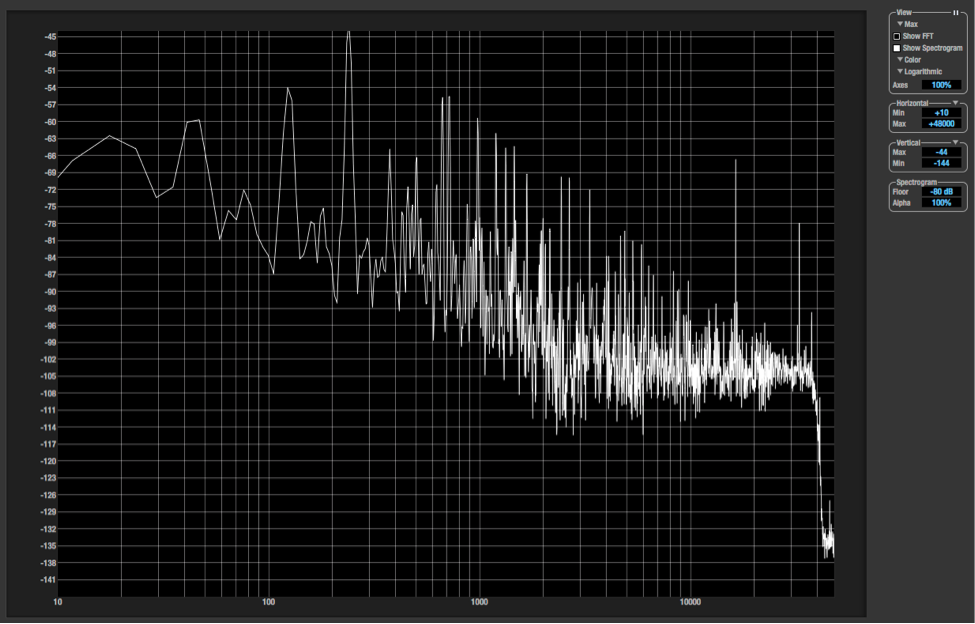
The following images show the spectrum plots of the same waveform captures, allowing better analysis of the results. For these spectrum plots only -60 dB to -144 dB is shown since we are interested in the noise floors. In these charts a value of zero dB represents a maximum amplitude sine wave just before clipping into the MOTU 16A Audio IO Interface. All samples were captured at 24 bit resolution and a 96 KHz sample rate, so the spectrum ranges from 20 Hertz to 48 KiloHertz. The y axis is amplitude in decibels and the x axis is frequency in Hertz. For the amplitude scale +6 decibels is a 2 times increase, +12 decibels is a 4 times increase, and +20 decibels is a 10 times increase in amplitude.
The K2500RS KDFX has a few high frequency spikes and assorted frequency components, while the newer M300, still over 15 years old, has a relatively flatter spectrum. Going forward the M300 spectrum will be used as spectrum reference.
With the spectrum plot for the Flying Bus Cables the noise across the entire spectrum is clearly seen. Even a simple system with FBCs and a quiet output module will not meet the requirements for a professional recording. However, with noise peaks under -100 dB, the casual listening experience or live performance will never notice the difference. For many synthesists the noise level is more than adequate for their needs. Others though will desire a cleaner solution, especially since there are many modules in a eurorack synthesizer than can amplify the noise levels even more.
The 1 Ounce Copper Bus Board shows clear spikes at 240 Hertz, 16 KHz and 45 KHz. Those frequencies come from three different modules. The 4 Ounce Copper Bus Board shows a reduction in some of those spikes and an increase in some others. That behavior was not predictable and shows that measurement is the final decider in noise comparisons. Neither of these bus boards reaches the flatness of the M300 reference output.
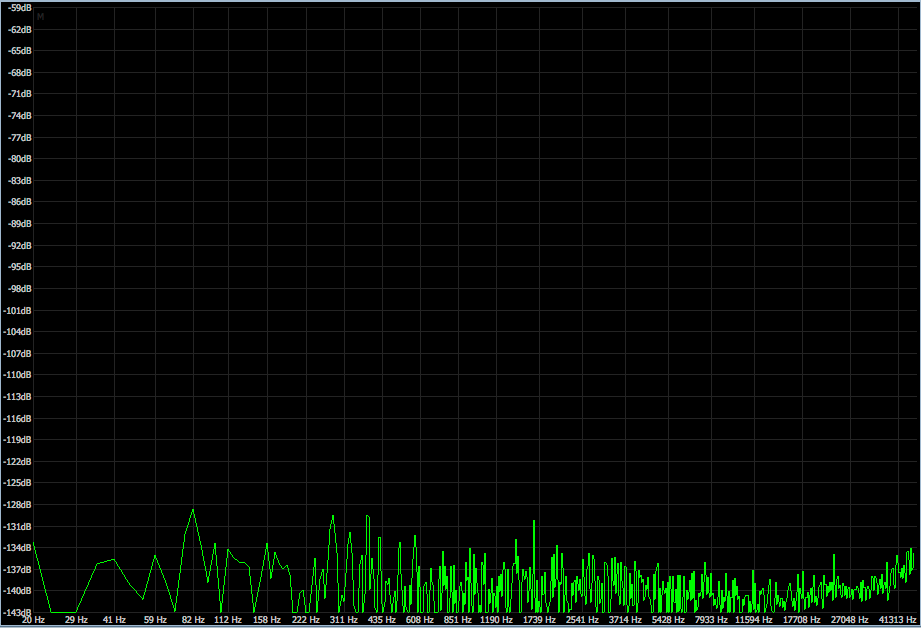
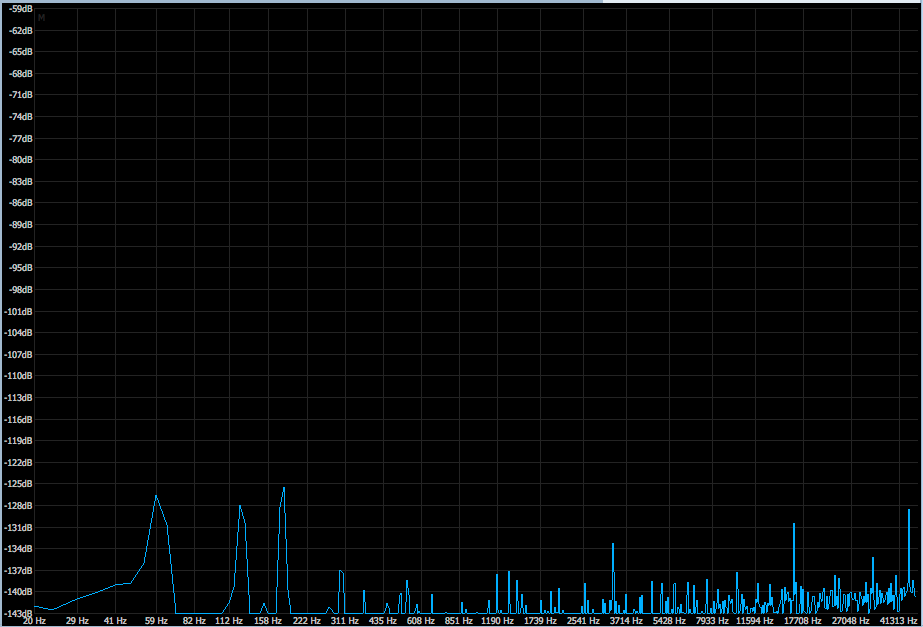
The Low Impedance Bus Board shows the lowest noise level. Those spikes at 60 Hz, 120 Hz and 180 Hz are the first, second and third harmonics of the AC Power Supply. Those frequencies are almost impossible to filter out because they are just too low. Also, since the 60/120/180 Hz is sourced from the power supply, none of the noise is from common impedance coupling, it is coupled soley through the power rails. For the remainder of the frequency range, LIBB is showing almost no noise coupling across the modules with the “quiet” output module, slightly better than either of the professional Kurzweil or TC Electronic spectrums.
The waveform amplitude differences are relatively small between all three bus boards because we are approaching the best possible noise floor in this system. The performance is limited by the very quiet linear power supply, and LIBB has the only output that can compete with the professional equipment noise levels.
Audio Waveform and Spectrum Results with an OTA based VCA module
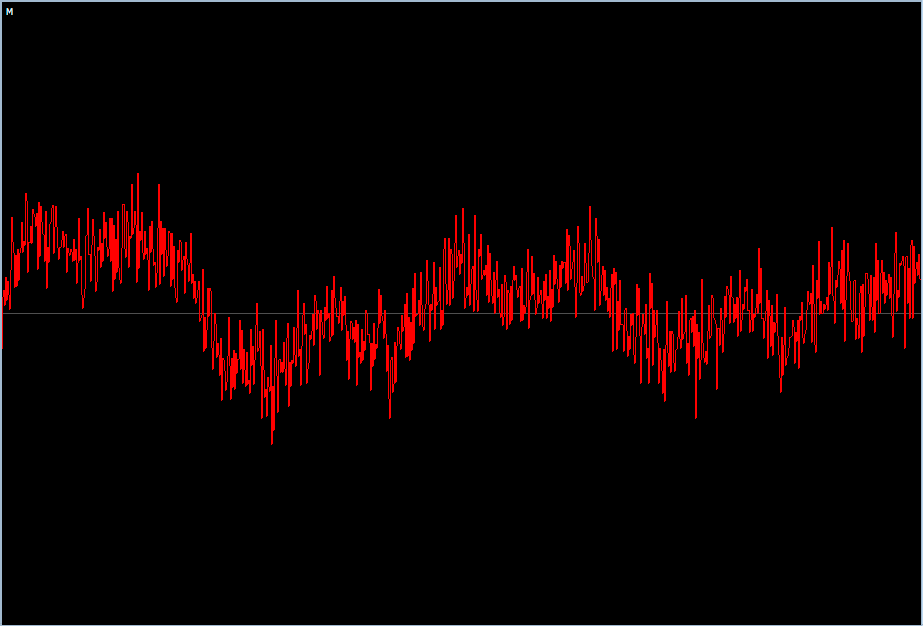
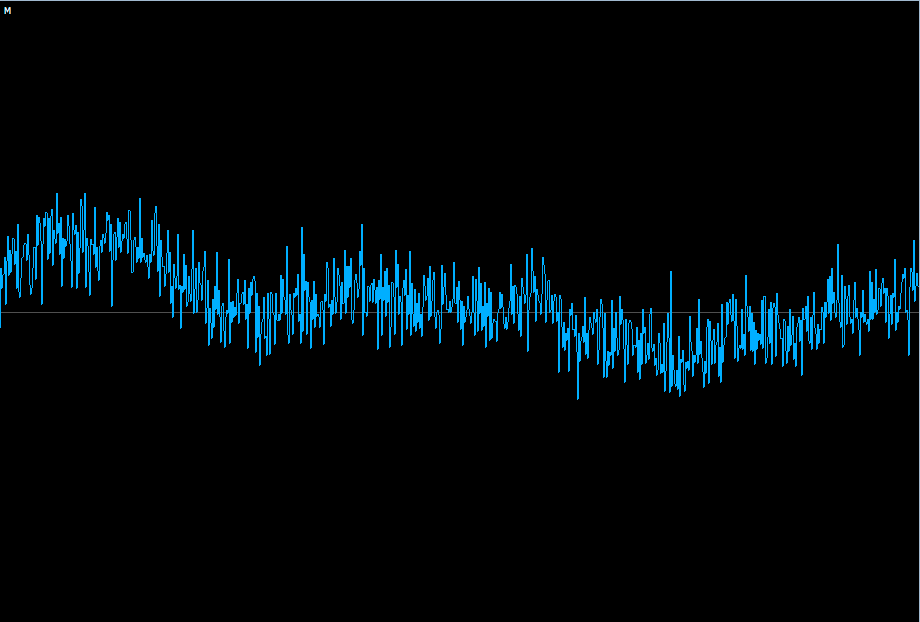

These test results use the output of an Operational Transconductance Amplifier (OTA) based VCA. OTA VCAs are inherently limited in noise rejection though usually better than transistor based VCAs. OTAs have no PSRR specifications. Many filters, VCAs, saturation circuits, crossfaders, stereo panners and ring modulators use OTA chips, particularly those that exploit them for their “vintage” sound. The waveforms are amplified +90 dB to get a maximum range for the highest amplitude noise. This range indicates that the OTA VCA has worse noise performance than Veils in the previous test.
The Flying Bus Cable again shows the most noise in multiple frequency ranges. The 1 Ounce Copper Bus Board shows more high frequency improvement and modest low frequency improvement. The 4 Ounce Copper Bus Board shows better low frequency improvement at about 40% of the amplitude of the FBC. The Low impedance Bus Board shows the best low frequency improvement with about 25% of the amplitude of the FBC. Looking at the M300, also amplified to +90 dB, as a reference, only the solution with the VCA in LIBB approaches the noise performance of professional equipment.
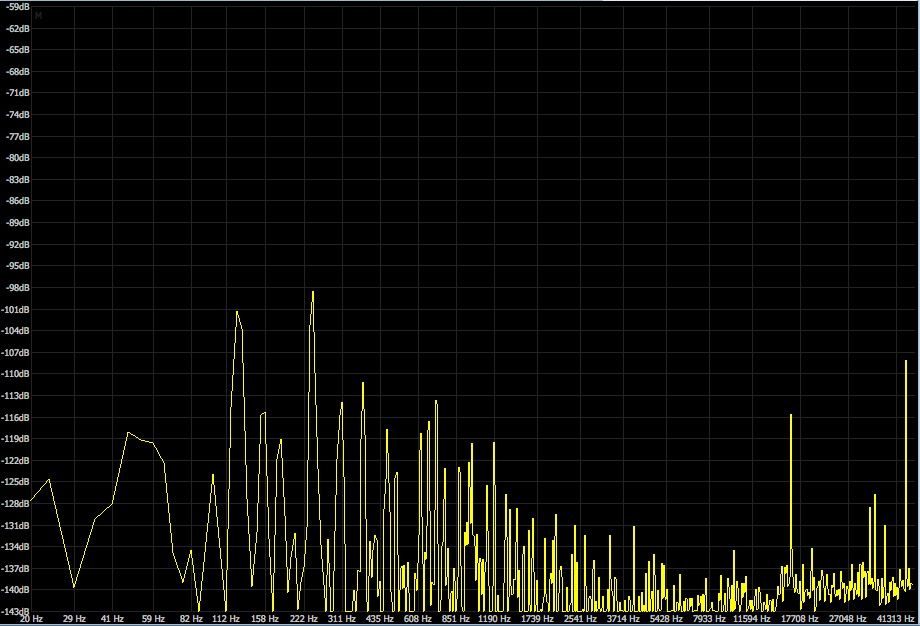
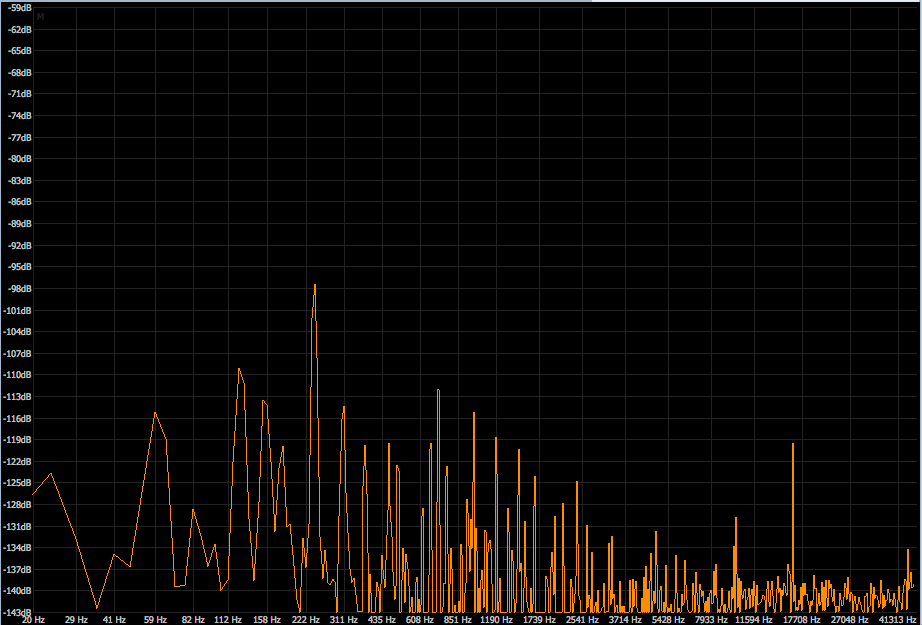

As with the previous example the spectrum plot is used for additional detail. There is a lot of low frequency energy in the noise, generated by VCOs and LFOs in low frequency ranges and LEDs from the trigger generator. Fast transients on these LED circuits can generate dozens of harmonics across the spectrum. Once we get into the kilohertz range the noise is largely generated by module sampling frequencies, which can be trigger generators, digital LFOs or digital VCOs or processing modules. While the spectrum plots look noisy, this is very respectable performance for this class of device.
The spectrum plots continue to show the pattern, as more copper is added, the noise is reduced in the OTA VCA’s output. Flying Bus Cable is the worst, while LIBB is the best.
Audio Waveform and Spectrum Results with an Attenuverter plus DC Offset module
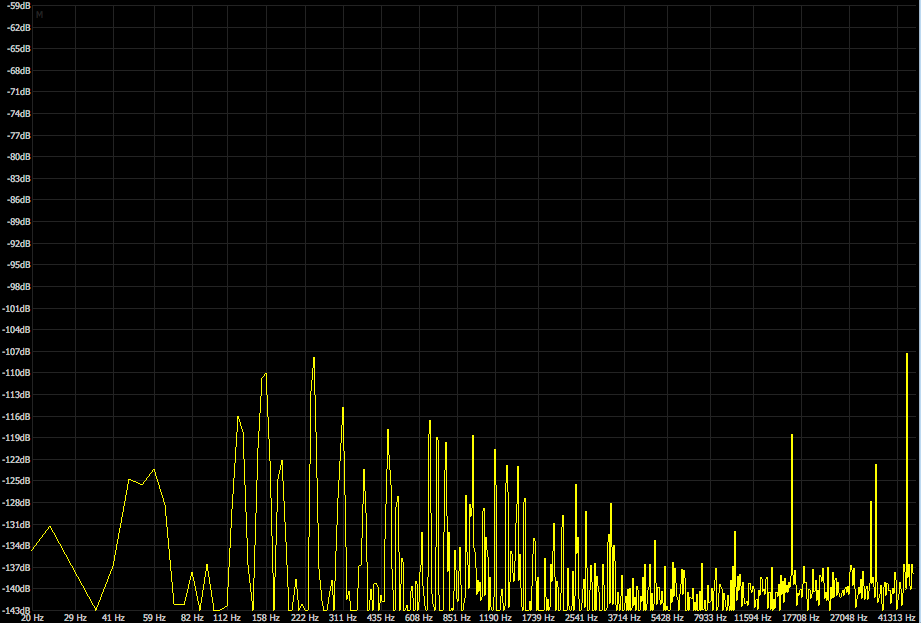
This series of tests shows results for output noise on an Attenuverter plus DC offset module. The module will not be named here. It is a fairly common make and model in the top 10 of 4 hp “Polarizer” modules on ModularGrid. Some other Attenuverter/DC Offset modules have similar circuit designs, so it is not alone in its noise performance. The amplification factor of +72 dB is a giveaway that this module is much noisier than the previous modules. The M300 noise output is given at +72 dB amplification as a reference point, and becomes nearly a flat line at this level.
Starting with the Flying Bus Cable we see the largest amplitude noise for the entire audio range. The 1 Ounce Copper Bus Board shows about a 25% reduction in noise amplitude. The 4 Ounce Copper Bus board shows about a 50% reduction in noise amplitude over the FBC. Both of these bus boards have large amounts of high frequency noise. The Low Impedance Bus board shows about a 75% reduction from the FBC, with significant high frequency reduction. None of these outputs match the desired noise floor.
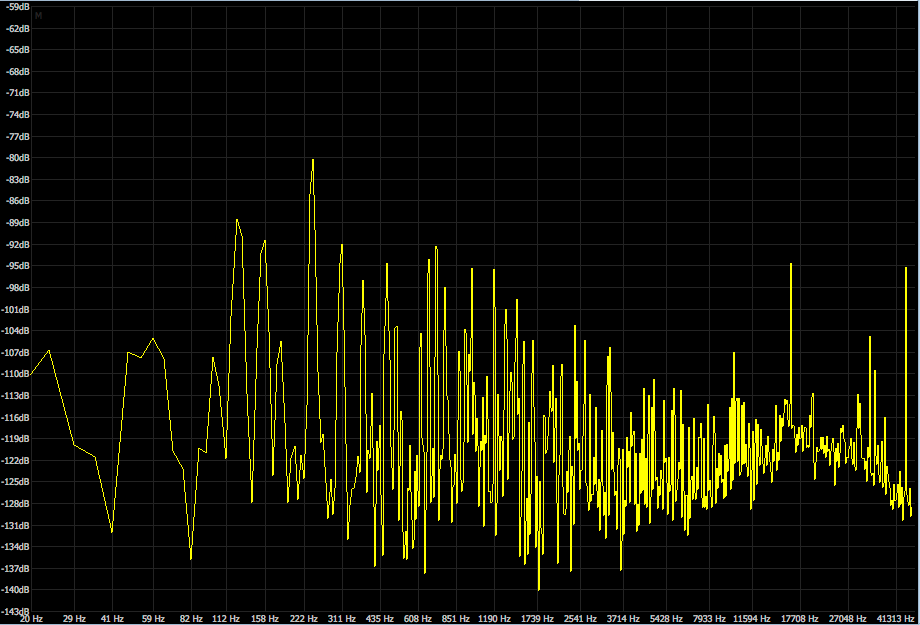
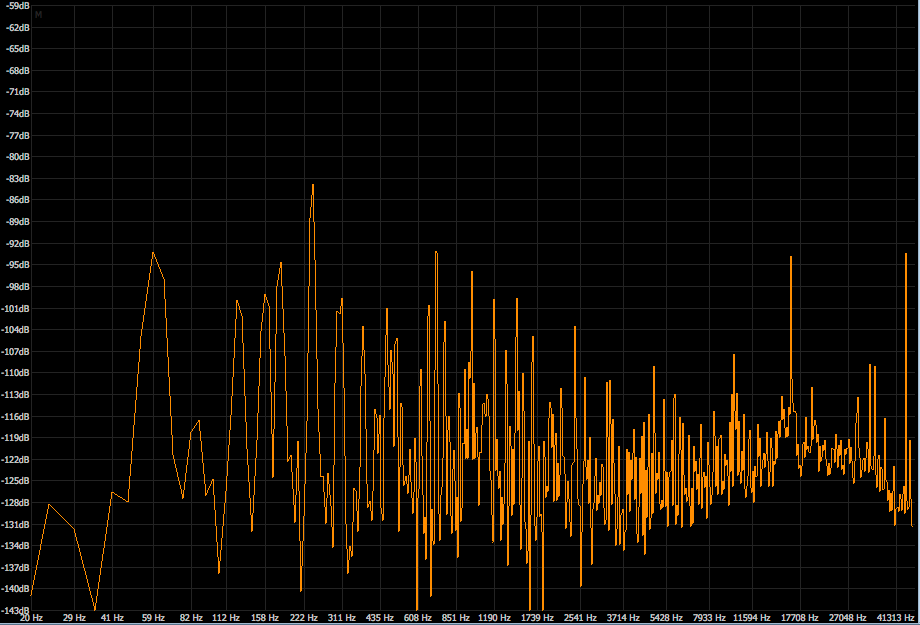

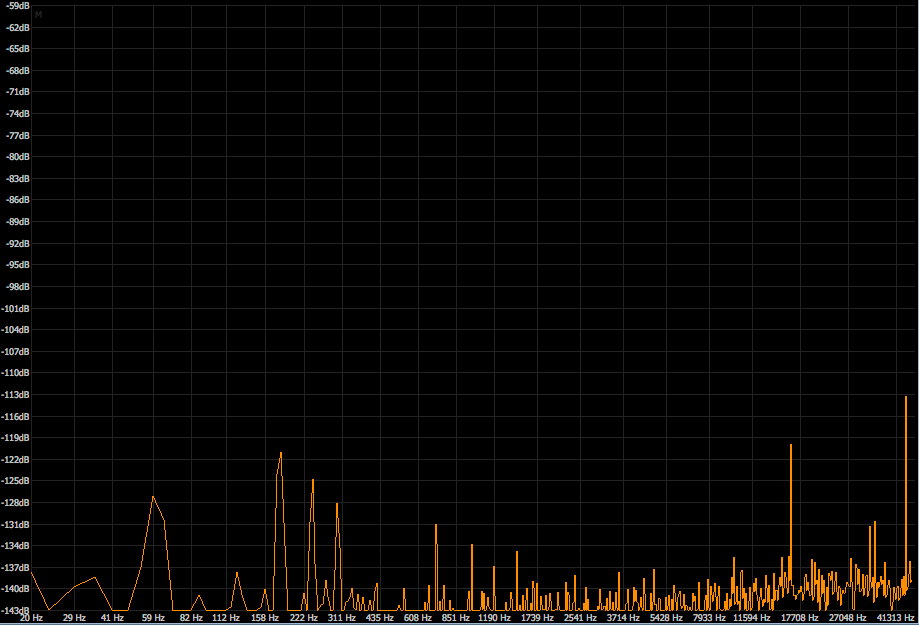
The spectrum plots give some more information about the output noise of the attenuverter module. Small incremental improvements are seen in the lower frequency noise below 2 KHz, moving from Flying Bus Cable to 1 Ounce Copper Bus Board to 4 Ounce Copper Bus Board to Low Impedance Bus Board. The biggest difference is in the high frequency noise beginning around 4 KHz. The first three solutions show a rise in the noise floor above those frequencies, only dipping down as frequencies approach half the 96 KHz sampling rate, probably from the audio interfaces analog-to-digital converter’s anti-aliasing filters. LIBB stays reasonably flat.
The noise profile is changing because the primary cause of noise coupling has changed from the previous Veils and VCA modules. This attenuverter module connects the +12 Volt power bus directly to a DC offset potentiometer and into an op amp summing network. This couples power bus noise directly into the signal path. Power decoupling capacitance and inductance cannot reasonably solve the noise at the bus board or module level. The circuit design practice of using direct +12V or -12V for DC offsets will bypass Power Supply Rejection Ratio (PSRR) benefits from active devices such as op amps, voltage regulators and voltage references. It does not matter if the DC offset control is nulled to zero offset, the noise is now always coupled into the circuit and the output. A better module design uses a voltage reference or voltage regulator to generate a local noise free reference voltage for any DC offsets. Many Attenuverter/Offset modules are designed that way and the result is similar performance to Veils as shown in the first examples.
LIBB shows the improved performance because of the three large 220 uF capacitors per power rail. Those capacitors begin controlling power rail noise about 4 KHz, as will be shown in the Impedance (Z) vs. Frequency section. Below 4 KHz the power rail noise mitigation is dominated by the output regulator impedance, so it is similar for all power solutions.
The overall noise profile changed because this output is now a voltage rail noise dominated circuit, rather than noise derived from common impedance coupling. Only by controlling the power rail noise can this noise be reduced. A Eurorack module cannot contain enough capacitance to help, it must be provided at the bus level. More information on this topic is in the power bus measurement section.
Combined results from Veils, VCA and Attenuverter
- Flying Bus cable response is almost always the worst. Best case it is comparable with the 1 Ounce Copper Bus Board and even 4 Ounce Copper Bus Board in a few cases.
- The 1 Ounce Copper Bus Board and 4 Ounce Copper Bus Board show the greatest similarity, usually within 1 to 5 dB of each other.
- The Low Impedance Bus Board shows the best result for every single measurement, and excels at higher frequency reduction by a wide margin.
- The number one variable for controlling noise is the output module in your audio signal path. It has the greatest impact on the noise level. Testing modules such as VCAs, mixers and attenuators for noise will provide guidance on which ones are generating the noise, which ones to avoid in a mix, and which ones to use as a final VCA stage to eliminate extra noise.
- While one may be able to weed out or control the use of ultra high noise modules such as the attenuverter example, it is unreasonable to eliminate every OTA or transistor based VCA and VCF design in your system. Those modules are too numerous, and too interesting in many cases, to eliminate from any respectable Eurorack system.
- The number two variable for controlling noise is the power distribution system. As more copper was used for the ground and power rails, the noise was reduced proportionally. The exception was the 1 ounce copper bus board, which actually has higher resistance than the flying bus cable. This result deserves some further modeling and measurements as the 1 ounce copper results were somewhat better than expected.
- While the data is not shown here, in the course of these tests it was clear that predicting a strong noise generating module was not always assured. Some modules generated noises at unexpected frequencies, while others generated almost no noise at all. Trying to predict the noise in the system will be a frustrating experience for anyone. Trying to control it through module rearrangements is nearly impossible.
- The addition of effective capacitance on LIBB enables greater high frequency noise reduction. At 1.2 KHz LIBB was 5 to 6 dB better than 4 ounce copper, at 16 KHz it was consistently 9 to 15 dB better than 4 ounce copper.
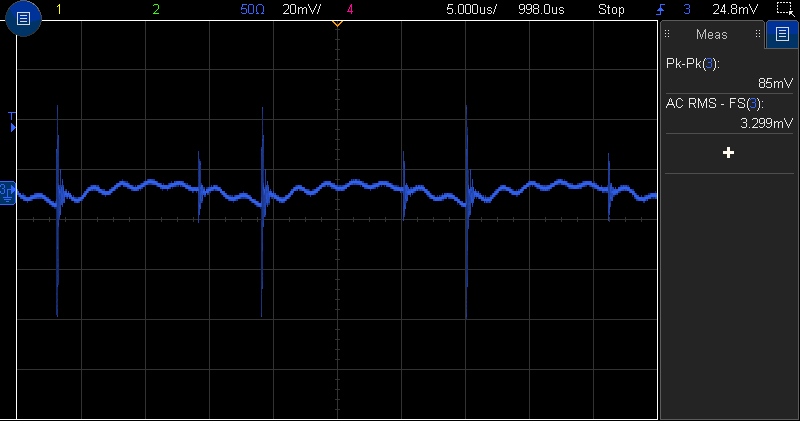
Power Bus Measurement Results
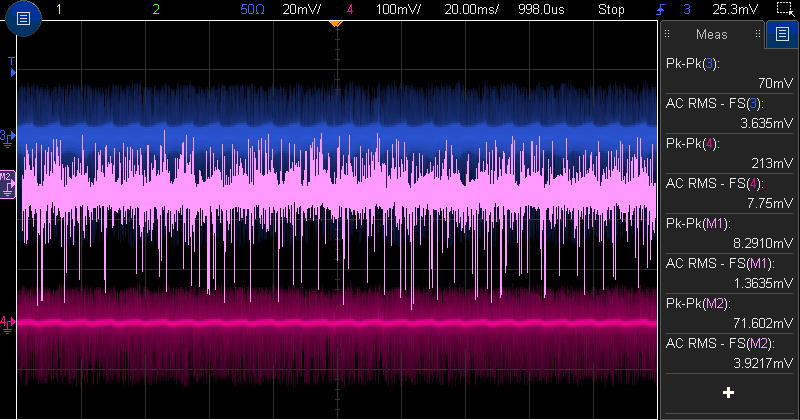
While running these audio tests an oscilloscope was connected to the +12 Volt power rail to measure AC noise. The images show the amplified AC noise on the power supply rail (light violet color waveform), plus the spectrum plot (FFT = Fast Fourier Transform, in white) in the range from 0 to 48 KHz. The spectrum amplitude y axis is logarithmic, in decibels (relative to 1 Volt rms), while the frequency x axis is linear, unlike the previous spectrum plots. Automated measurements are captured in right hand box. The +12 V AC noise peak to peak voltage is “Pk-Pk(M2).” The +12 V AC noise RMS (Root Mean Square) voltage is AC RMS – FS(M2).” The maximum spectrum plot amplitude is “Max(FFT),” while the average spectrum plot amplitude is “Avg – FS(FFT).”
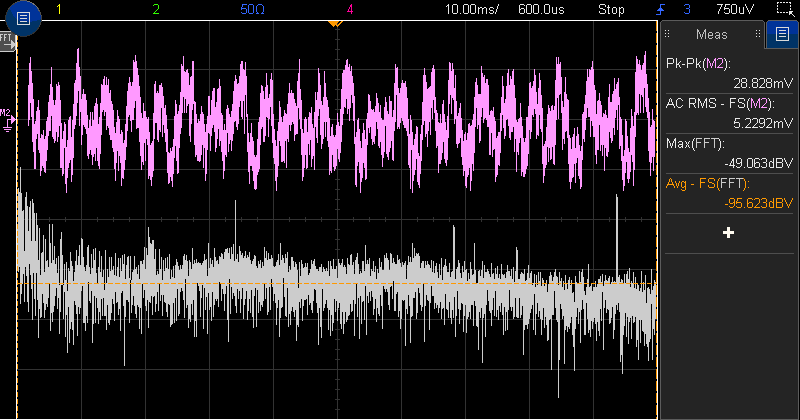
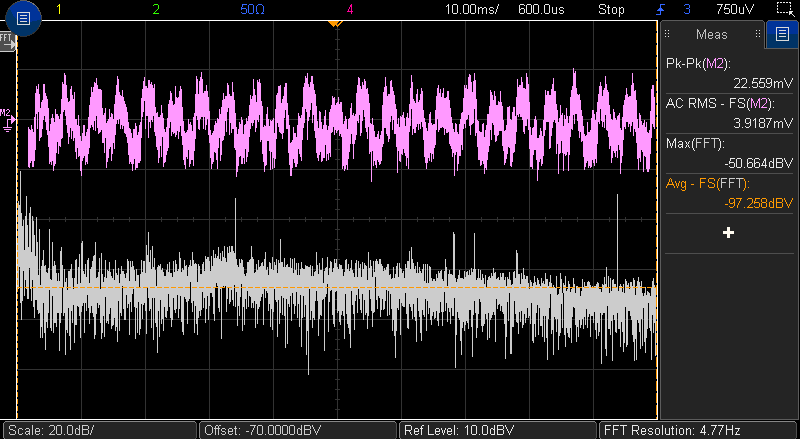
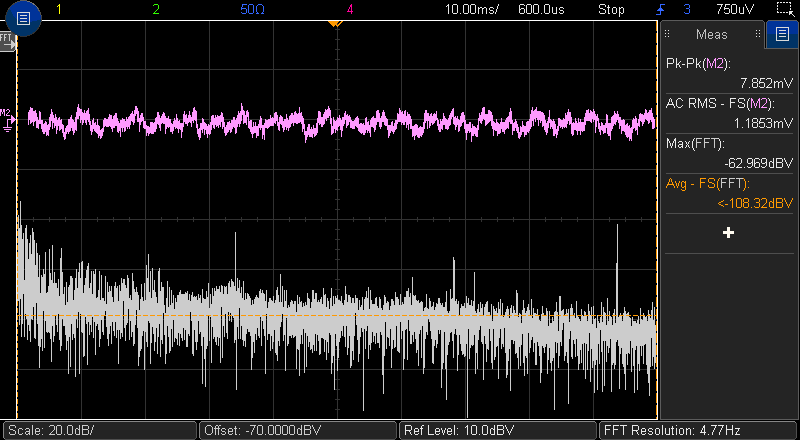
Looking at the light violet waveforms, the flying bus cable shows the expected worst +12 Volt power noise at 28.8 mVpp and 5.2 mVrms. More interestingly the 1 ounce copper bus board with through hole capacitors shows minimal improvement at 22.6 mVpp and 3.9 mVrms. The truth about bus boards with through hole capacitors is that they provide almost no benefit for power rail noise filtering. The problems with typical through hole capacitors and benefits of low ESR and surface mount capacitors are explained in more detail in the section What is ESR, |Z|, |Z| vs. Frequency and PDN?
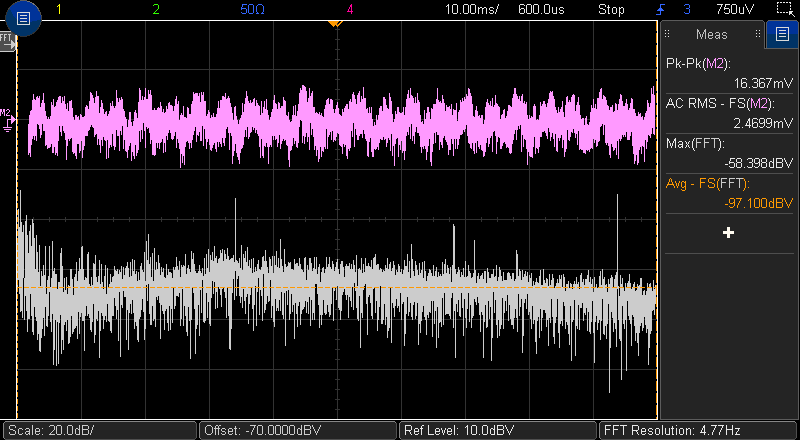
The lack of through hole capacitors improvement is reinforced with the 4 Ounce Copper Bus board results, which has lowered noise compared to the 1 ounce board even though there are no capacitors on board. Noise is reduced to 16.4 mVpp and 2.5 mVrms. The 4 Ounce Copper Bus board RMS noise voltage is less than half that of the flying bus cable. The Low Impedance Bus Board (LIBB) shows the maximum improvement. It’s noise RMS voltage is less than half of the 4 Ounce Copper Bus board, doubling the improvement of the next best solution at 1.2 mVrms. The peak to peak noise is also reduced to less than half of the nearest solution at 7.9 mVrms.
Some additional comments on the importance of bus board capacitance will be provided before continuing with the analysis. One common thought is that modules provide their own decoupling capacitors at the power rails, so none is needed or useful at the bus board. That assumption is wrong. A typical decoupling scheme at the Eurorack module level is one 47 uF capacitor and one 0.1 uF capacitor at the power entry location. Sometimes a ferrite bead in series with the power connection precedes the capacitors. Either combination provides filtering above the audio range, starting around 30 KHz, and no filtering at 20 KHz or below. Ferrite beads are effective at controlling noise in the MegaHertz plus range, not for audio. Large amounts of capacitance are need to address audio frequency noise. Unfortunately if every module contained capacitors greater than 100 uF then most power supplies will not start up due to the huge startup current to charge all those capacitors. Not only can a bus board do filtering that is not possible in every module, it can also dampen the noise before it reaches the modules. This is an example of how the Eurorack power distribution needs to be treated as a system, not as an idealized concept. More information on the capacitance topic is provided in the What is ESR, |Z|, |Z| vs. Frequency and PDN? subsection.
The spectrum plots (in white) look different from the previous audio output captures because of the linear frequency scale. The amplitude in DB represents a two times difference for 6 dBV. The peak about a third from the left is 16 KHz and the peak to the far right is 45 KHz. The flying bus cable and 1 Ounce Copper Bus board show very little difference for max or average spectrum amplitude values. The 4 Ounce Copper Bus board shows a good improvement in the max spectrum amplitude, down to -58.4 dBV, about 8 dB better than the first two. The Low Impedance Bus Board shows the maximum improvement with maximum spectrum amplitude at -63.0 dBV. More significantly, the average spectrum amplitude for the other three solutions ranged from -95.6 to -97.3 dBV, while LIBB has an average of -108.3 dbV. That is around 12 dB, or a four fold improvement in the noise across the linear frequency scale.
In this experiment it is difficult to determine how much of the LIBB improvement is due to reduced power plane resistance and the on board capacitance. The LIBB +/-12 Volt power planes have about one tenth the resistance of the 4 Ounce Copper Bus board. The on board capacitance is very effective at the upper audio frequencies, 2-4 KHz and higher, up into the MegaHertz range. It is expected both are contributing to the superior noise reduction based on experiments with the first prototype. To separate the two parameters would require measurements of LIBB without the on board capacitors.
Table of Power Bus Results
|
Bus Solution |
Noise (mVpp) |
Noise (mVrms) |
FFT (max dBV) |
FFT (average dBV) |
|---|---|---|---|---|
|
FBC |
28.8 |
5.2 |
-49.1 |
-95.6 |
|
1ozBB |
22.6 |
3.9 |
-50.6 |
-97.3 |
|
4ozBB |
16.4 |
2.5 |
-58.4 |
-97.1 |
|
LIBB |
7.9 |
1.2 |
-63.0 |
-108.3 |
- Flying bus cables have the worst power bus noise. That is no surprise.
- Typical 1 Ounce Copper Bus boards, with or without through hole capacitors, show only a small improvement in power bus noise over flying bus cables.
- Heavier 4 Ounce Copper Bus boards can show a two times improvement in power bus noise over the flying bus cable.
- A multilayer bus board (LIBB) with effective surface mount capacitors can show a four times improvement in power bus noise over the flying bus cable.
Can switching power supply noise be filtered out with a bus board?
Yes. LIBB provides the best high frequency filtering of any bus distribution system. For 60 Hertz AC noise and its harmonics, seen in both linear and switching power supplies, the power bus cannot be easily filtered, but LIBB can be effective there as well when run in parallel to a large power supply.
The images below compare a switch mode (or switching) power supply connected to four different types of bus power: flying bus cable (ribbon cable), 1 ounce copper bus board with capacitors, 4 ounce copper bus board, and the Genus Modu Low Impedance Bus Board.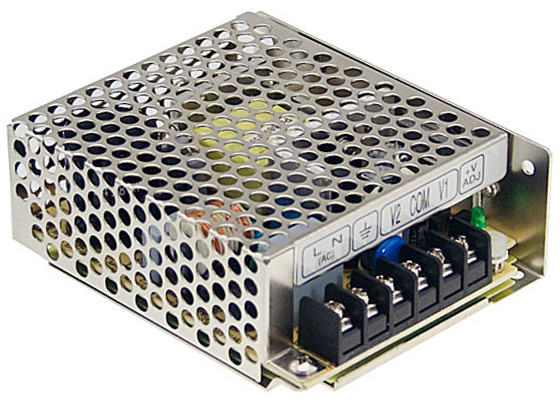
The comparison is for different power bus solutions driven by a commodity switching power supply. The power supply used is a Meanwell RD-3513 Dual tracking switching Power Supply Unit (PSU) with an enclosed chassis. The power supply costs $12-16 from suppliers. It has 120/240 VAC inputs and is a single stage switching power supply design. Its nominal voltage outputs are +/-13.5 volts, however there is a trimmer that allows tuning it to +/-12V. The PSU is rated at 1.3 Amps for each power rail. The load is fixed 25 watt power resistors, two 24 ohm and one 39 ohm for 1.3 Amps of load on +12 V and two 24 ohm resistors for 1.0 Amps of load on -12 V. Maximum specified ripple and noise for the RD-3513 is 120 mVpp (peak to peak) at the 1.3 Amp rated load. This power supply is similar to other commodity PSUs deployed in some Eurorack cabinets. Switching PSUs are known for putting out lots of high frequency noise. Dual stage setups can create even more noise, with ripple and switching spikes from the wall adapter coupling into the secondary stages generating the final +/-12 Volts.
This is only a comparison, not a recommendation for a specific switching power supply. Every switching power supply has different characteristics, requiring testing for every model. For the lowest noise system, linear or a well designed hybrid power supplies are preferred.
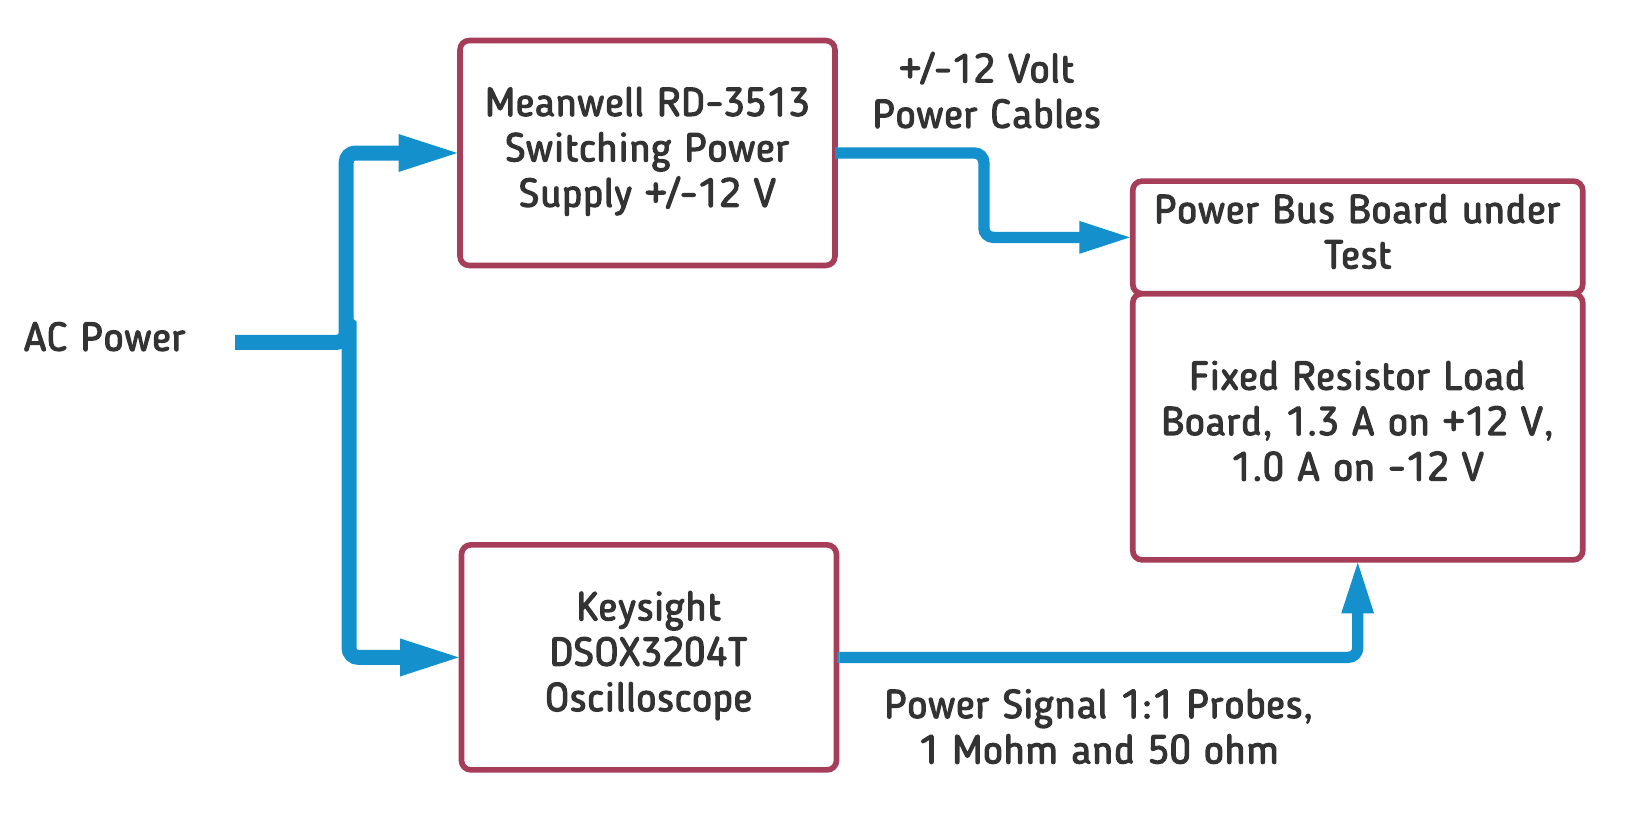
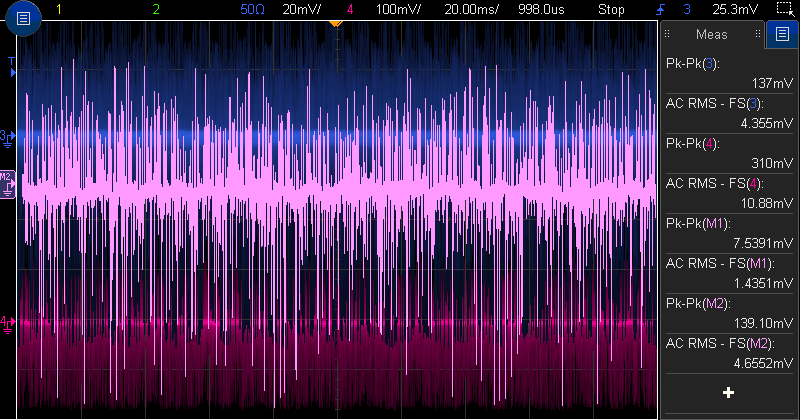
The noise is measured using a Keysight DSOX-3024T Digital Oscilloscope. Channel 3 in blue is a 50 ohm 1:1 terminated input for maximum EMI reduction, using a DC block with a 1 KHz high pass frequency (HPF) cutoff. Channel 4 in hot pink (fuchsia) is a 1 Mohm 1:1 input channel for capturing frequencies below 1 KHz. Both channels are bandwidth limited to 20 MHz. The pink image is a mathematically derived channel, with low pass filtering of Ch4 at 1 KHz, then added to Ch3 for a composite waveform representing an accurate picture of the noise that is actually on the wires. The measurements are taken at the euro header bus connectors for powering modules using the shortest possible connections. The images for each set of comparisons use the same amplitude and time division scales so they can be visually compared to one another.
The first image shows the result using flying bus cables with a switching PSU. Not pretty, is it? There is 139 mVpp (Peak to Peak) noise and 4.65 mVrms (think of as average noise) noise. The peak to peak noise is worse than the Meanwell noise and ripple specification because they game the measurement by adding a 47 uF and 0.1 uF at the end of the twisted cable measurement point. The setup for these measurements did not include those capacitors.
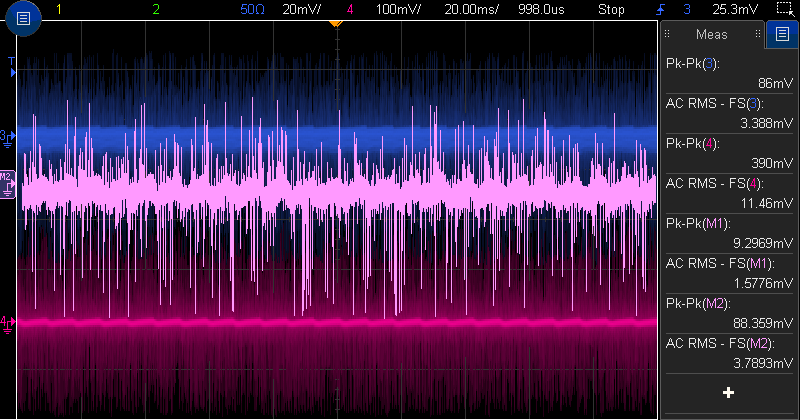
The next image shows a typical light 1 ounce copper bus board that adds some capacitors. Noise and ripple is 71.6 mVpp and 3.92 mVrms. However, notice how the middle part of the scope capture looks “thicker.” More information on that characteristic will be presented later.
Next is a heavy 4 ounce copper bus board, without any capacitors in its design. Noise and ripple is mixed compared to the 1 ounce copper bus board, with 88.4 mVpp and 3.79 mVrms, so slightly worse on peak to peak and slightly better on RMS voltages.
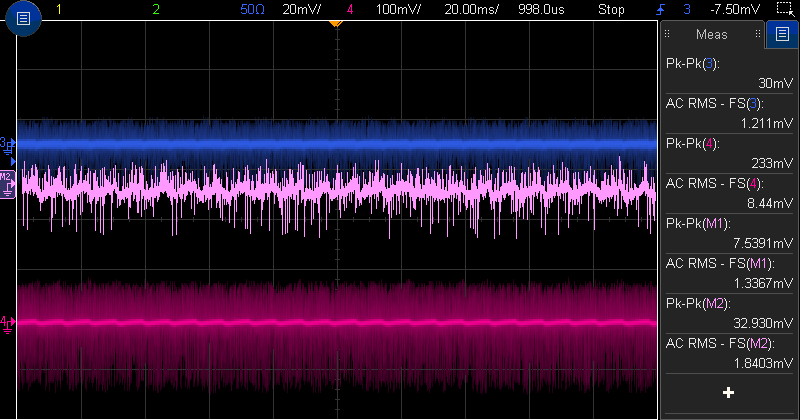
Finally we have the Genus Modu LIBB. Notice the huge reduction in noise and ripple, now down to 32.9 mVpp and 1.84 mVrms. As a reminder, the power supply and load have remained the same during the last four images, only the power bus distribution has changed. LIBB uses Power Integrity design techniques to provide the maximum noise filtering possible with a bus board. Both ground and power planes provide a low impedance path to low impedance surface mount MLCCs (Multi Level Ceramic Capacitor). Through hole capacitors are simply not as effective once the value gets below 25 uF. For LIBB there is a special mix of capacitor values to insure consistent noise reduction across the frequency range, from the low KiloHertz to over 6 MHz.
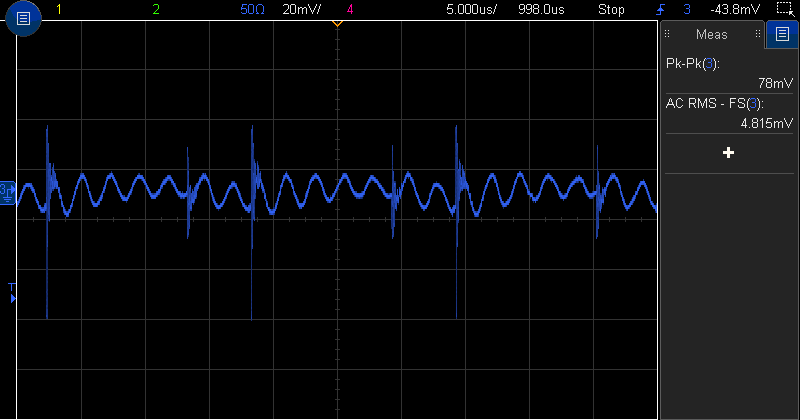
Now, let’s look at the details of the signals on three of the bus boards, to see exactly where the noise is reduced. The images show only Channel 3, the 50 ohm 1:1 scope probe with an effective 1 KHz HPF through a 50 ohm DC block, so frequencies below 1 KHz are filtered out. The first image from the Flying Bus Cabled system shows huge high frequency spikes along with lower frequency ripple. The sine wave like ripple is at 310 KHz, while somewhat less noticeable is the “hump” that repeats three times, at 62 KHz.
Why should you care about frequencies of 62 KHz, 310 KHz and the higher frequency and energy spikes? Those frequencies are higher than anything you would capture with even 96 KHz audio recording. Two major reasons are given below.
The first reason is analog video synthesis applications such as products by LZX Industries. Analog video has frequency components from 20-30 Hertz up to 6 MHz. Most switching power supplies have ripple and spikes in the range from 20 KHz to 1 MHz, and spikes have harmonics into the tens of MegaHertz. Switching noise will show up in analog video in various ways depending on the source or processing function of the video module, as perturbations or noise in your final video output.
The second reason to be concerned with ultra high frequencies is for interaction with control voltage or audio focused modules. While the frequencies shown here fall outside the useable audio range, the noise can have side effects on internal module operations. Among the examples of possible high frequency noise interference are jitter on VCO frequencies, skipped or double triggering from trigger generators, digital logic glitches, high frequency capacitor whines from physical oscillations, PN junction rectification causing distortion and DC voltage offsets, lock ups or erratic operation for microprocessor based modules, noise on Analog to Digital Converter inputs and Digital to Converter outputs, and unexplained distortion on processing modules, which can still amplify frequencies above the audio range even if you cannot hear them. These types of issues can be frustrating to debug and often require placing the module in a secondary system with a different power supply, usually a linear one, to quell the noise interference. If these noise can be controlled at the bus board then may be solved without the additional cost and weight of linear power supplies.

The next image is the Light Copper bus board with capacitors intended to provide noise filtering. The high frequency spikes are reduced, but the 310 KHz component is three to five times larger than the flying bus cables! This shows an unfortunate resonant peak in the 300 KHz frequency range, right where most switcher PSU harmonics will reside. The truth is that there has been limited thought process in the capacitor selection and the capacitors are completely ineffective for the frequencies that need to be controlled on a bus board. This board has one standard through hole electrolytic capacitor, not low ESR, and two through hole MLCC capacitors, also not low ESR when compared to their surface mount equivalents. See the subsection What is ESR, |Z|, … for an explanation on ESR (Equivalent Series Resistance) and why it matters. The 62 KHz fundamental of the switcher PSU is also quite prominent, perhaps amplified a bit as well.
A noise filtering bus board should not amplify noise, but that is exactly what you get with most of these designs that provide no real specifications on filtering response. Do not be fooled into thinking that just because a board has capacitors on it that it is doing an effective job. If it does not use surface mount caps for the sub 40 uF values it will have poor high frequency filtering similar to the one shown here.
The next image shows the 4 ounce heavy copper bus board results. It is somewhat better than the flying bus cable, without the negative effects of the poorly decoupled low copper bus board. It has no capacitors on board, so the improved results are due purely to heavier copper distribution.
Finally the Genus Modu LIBB scope capture shows noise that is three times lower than the 4 ounce copper bus board. The Low Impedance Bus Board has significant reductions for all of the noise frequency components, the high frequency spikes, the 310 KHz fifth harmonic, and the 62 KHz fundamental for the switcher PSU. That is by design, consistent noise reduction across the greatest possible range. The theory section of this white paper explains how LIBB meets those goals through specific engineering design methodologies.
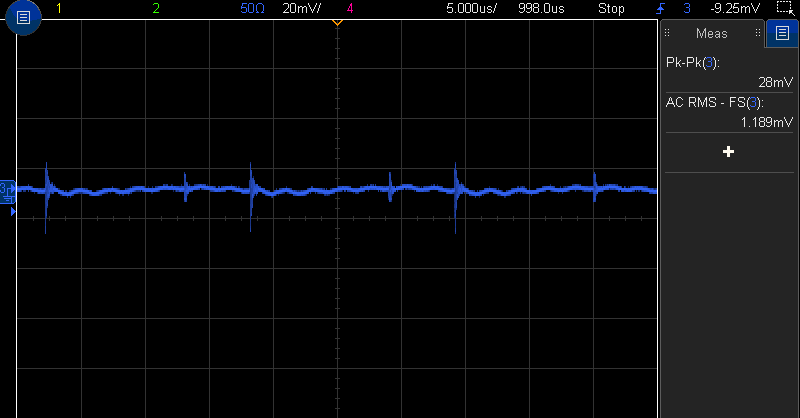
Table of Results for Switching Power Supply Measurements
|
Bus Solution |
Combined Noise (mVpp) |
Combined Noise (mVrms) |
High Frequency Noise (mVpp) |
High Frequency Noise (mVrms) |
|---|---|---|---|---|
|
FBC |
139 |
4.66 |
131 |
4.35 |
|
1ozBB |
72 |
3.92 |
78 |
4.82 |
|
4ozBB |
88 |
3.79 |
85 |
3.30 |
|
LIBB |
33 |
1.84 |
28 |
1.19 |
Resistance Measurements
What is the resistance of ribbon cables, connectors, common bus boards and common wire sizes?
| Bus Distribution Type | Bus Distribution Method | Length | Main Power Connector Location | Main Power Connector |
|---|---|---|---|---|
| Flying Bus Cable | 28 AWG wires, 6 for ground, 2 for each power rail | 10-20 inches/ 25-50 cm | End | 16 Position 2x8 Header |
| Light Copper Bus Board, 1 ounce copper | 2 layers of 1 ounce copper, wide traces for power and ground | 13-17 inches/ 33-43 cm | End | 16 Position 2x8 Header, Molex power connectors, terminal blocks, spade lugs, various others |
| Heavy Copper Bus Board, 3 or 4 ounce copper | 2 layers of 3 or 4 ounce copper, wide traces for power, bottom plane layer for ground | 13-15 inches/ 33-38 cm | Middle | Molex TTA connectors, spade lugs or screw terminals |
| Genus Modu Low Impedance Bus Board | 6 layers of 2 ounce copper, 1 plane each for +12V and -12V, 3.5 planes for ground, 200 mil wide trace for +5V | 11.2 inches/ 28.5 cm | Middle | Barrier Strip with screw terminals |
Printed circuit boards (bus boards) use different “weights” of copper for the electrical connections. A typical printed circuit board uses 1/2 ounce or 1 ounce copper. The term “1 ounce” is defined as the thickness of 1 ounce of copper rolled out to an area of 1 square foot. For 1 ounce copper that results in a layer of copper that is 1.4 mils or 35 um thick. That copper will also have a given resistance based on the length and width of any trace or plane. For 2 ounce copper the thickness is 2.8 mils or 70 um, and 4 ounce copper is 5.6 mils or 140 um. Two layers of 2 ounce copper will equal one layer of 4 ounce copper. There is however some differences in the fine detail. The heavier coppers require greater spacing between traces and planes. If looking at a profile view, this is because the etched copper is a trapezoidal shape, not rectangular and the greater distances are needed to prevent shorts during fabrication. The standard “bus strip” type bus board with euro headers in a single row is disadvantaged by the heavier copper since larger cutouts need to be made around pins, cutting into copper that should be used for distribution. The Low Impedance Bus Board places euro headers around the perimeter of the board for maximum copper usage, avoiding this issue altogether.
The tables below give resistance measurements for the most common types of Eurorack power distribution. The measurements can vary across products but are generally in the ranges as seen in the table. Each solution is limited by the physics of its design. The tables show the worse case measurements from main power to the furthest Euro Power connector pad. The Euro Power connector pin impedance is not included because they are part of the non-shared power path and do not contribute to noise coupling. Lower values are better and correlate to the amount of noise coupling reduction in the power distribution. Flying Bus Cable values include the parallelization of 6 wires and connections for ground and 2 wires for power rails.
The numbers in the tables are important because the lowest resistance power distribution will have the lowest noise coupling across modules. Note that the common light copper bus board (1ozBB) can have higher resistance than the ribbon cable and therefore greater noise in some instances. The simple 1ozBB design of long ~80 mil (milli-inch, about 2 mm) wide traces using 2 layers of 1 ounce copper is not suitable for a low resistance design.
| Power Bus Solution | Ground resistance, cable or board only (mohm) | Ground resistance, cable or board plus main power connector (mohm) | Power +12V resistance, cable or board only (mohm) | Power +12V resistance, cable or board plus main power connector (mohm) |
|---|---|---|---|---|
| Flying Bus Cable (FBC) 15 inches 28 AWG wires, end connector | 12.45 | 13.46 | 37.34 | 40.39 |
| 1 Ounce Copper Bus Board (1ozBB) with end Molex power connector | 16.64 | 17.04 | 62.69 | 64.27 |
| 4 Ounce Copper Bus Board (4ozBB) with center spade connector | 1.83 | 2.02 | 12.83 | 13.02 |
| Genus Modu Low Impedance Bus Board (LIBB) with center barrier strip connector | 0.37 | 0.69 | 1.22 | 1.87 |
| Power Bus Solution | Power -12V resistance, cable or board only (mohm) | Power -12V resistance, cable or board plus main power connector (mohm) | Power +5V resistance, cable or board only (mohm) | Power +5V resistance, cable or board plus main power connector (mohm) |
|---|---|---|---|---|
| Flying Bus Cable (FBC) 15 inches 28 AWG wires | 37.34 |
40.39 |
37.34 |
40.39 |
| 1 Ounce Copper Bus Board (1ozBB) with end Molex connector | 64.33 |
65.27 |
65.59 |
67.17 |
| 4 Ounce Copper Bus Board (4ozBB) with center spade connector | 12.37 |
12.56 |
39.68 |
39.87 |
| Genus Modu Low Impedance Bus Board (LIBB) with center barrier strip connector | 1.37 |
2.02 |
10.87 |
11.52 |
The 4 ounce copper bus board shows a solid reduction in ground path resistance, almost 10 to 1, over the 1 ounce copper bus board. It will definitely see improved noise performance. For the Genus Modu LIBB, counting only ground or +/-12V power rails, the resistance is 19-21 times better than the Flying Bus Cable, 24-33 times better than the 1 ounce copper bus board, and 2.9-7 times better than the 4 ounce copper bus board.
The board resistance is not the only factor. The cable resistance from the power source to the bus connector is an equal contributor to the noise. Long runs of cable can easily have higher resistance than the bus board, and this is a reason why remote power supplies outside of the eurorack cabinet are not a good idea. Based on the principal of common impedance coupling, all of the cable length from the power supply to the bus board counts against the noise budget of the system. The next table gives examples of resistances for various sizes of cable. Choose them wisely. Heavier wire is always better.
| Cable size AWG Stranded | Cable size UK | Cable size metric diameter | Resistance for 6 inch/15 cm cable in milliohms | Resistance for 12 inch/30.5 cm cable in milliohms | Resistance for 24 inch/61 cm cable in milliohms |
|---|---|---|---|---|---|
| 12 AWG | #14 SWG | 2.05 mm | 0.73 | 1.45 | 2.9 |
| 14 AWG | #16 SWG | 1.63 mm | 1.16 | 2.31 | 4.62 |
| 16 AWG | #18 SWG | 1.29 mm | 1.84 | 3.67 | 7.34 |
| 18 AWG | #19 SWG | 1.02 mm | 2.93 | 5.86 | 11.72 |
| 20 AWG | #21 SWG | 0.812 mm | 5.16 | 10.32 | 20.64 |
| 22 AWG | #23 SWG | 0.644 mm | 7.37 | 14.74 | 29.48 |
| 24 AWG | #25 SWG | 0.511 mm | 11.65 | 23.3 | 46.6 |
| 2 x 28 AWG Euro power | 2 x #30 SWG | 2 x 0.321 mm | 16.23 |
32.45 |
64.9 |
| 6 x 28 AWG Euro ground | 6 x #30 SWG | 6 x 0.321 mm | 5.41 | 10.82 |
21.63 |
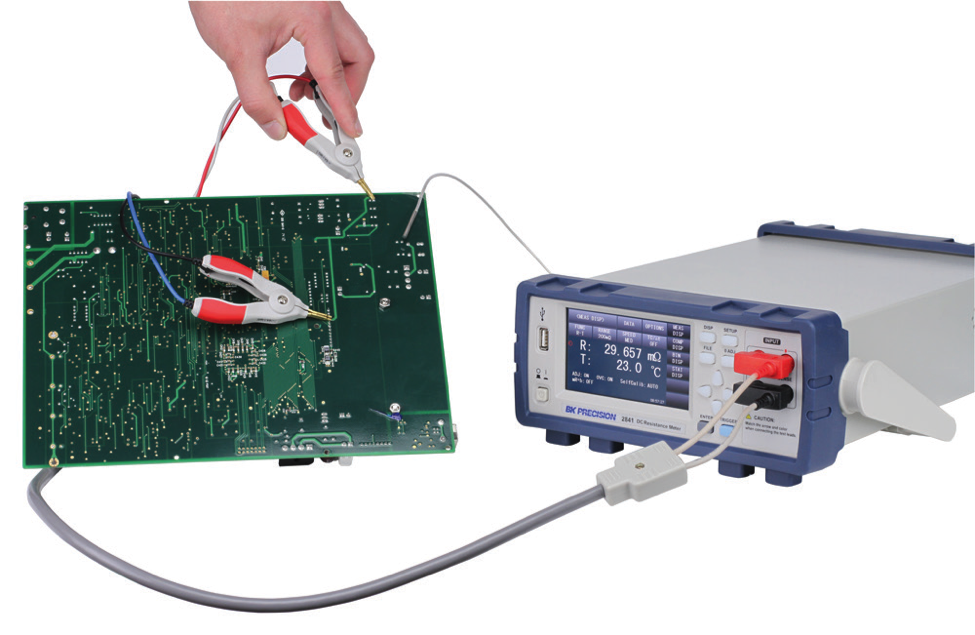
How do you measure resistances as low as fractions of a milliohm?
Resistances in the milliohm range cannot be measured with a standard Digital Multimeter. Low resistance is measured with a Milliohmeter. This device uses special Kelvin 4 wire test leads to induce current and measure voltage over two pairs of isolated wires. Measurements for LIBB and comparable bus boards have been made with a calibrated BK Precision 2840 DC Resistance Meter with accuracy to 0.1% for a 20 milliohm range and measurement resolution to 1 micro-ohm.
Practical Advice
What gauge or size of wire should I use for power distribution?
For power distribution always use the heaviest wire gauge possible. For Genus Modu LIBB 12 AWG wire is recommended. Lighter gauges can be used with a small degradation in performance, but considering the cost of wire versus the bus solutions it does not pay to go cheap. Also double up wires whenever possible, or double up lighter gauges for easier wiring with more flexible wires. This lowers the resistance and proportionately reduces any noise coupled within the system. For example, two 16 AWG wires have a resistance that is almost as low as one 12 AWG wire. Lowering the resistance from power source to bus board is just as important as lowering the bus board resistance. Noise coupling occurs across both of them through common impedance coupling.
The number of ground wires and connections should match the number power wires and connections, as ground carries return currents for all power rails. That is why LIBB has two ground connections, not just one. Generally the +5V power rail sees very light use in eurorack systems so that rail is “discounted” in the ground connection count.
Do I need special heavier gauge power cables or patch cables for my modules?
For module power cables the answer is no, heavier gauge power bus cables are not going to improve power bus coupled noise. The thickness or gauge of the cables between bus board and a single module has nothing to do with the power bus noise. That noise is only caused by shared resistance across module power and ground rails.
Lowering the resistance from power bus to module could theoretically help with noise coupled across modules through patch cords. However, if there is a high resistance between the module’s power connector and its front panel jacks, then the heavier gauge power cable makes little difference. Typical Eurorack module measured resistance from the power connector ground to the jack ground ranges from 5 to 30 milliohm. Most eurorack ribbon power cables are 28 AWG. A nine inch 28 AWG cable has about 8.5 milliohms of resistance for the six ground conductors. Ribbon cable is available at 26 AWG but is more expensive, so it is unlikely to be used in your cables. A custom built nine inch 26 AWG cable has about 5.0 milliohms of resistance for the six ground conductors. There are some special cables with 24 AWG wires for even lower resistance. But looking at the total solution, if the module power cable ground resistance goes from 8.5 to 3 to 5 milliohms, while the module ground resistance remains at 5 to 30 milliohm, then improving the power cable just won’t help that much. The small improvement delta is not going to make a difference when considering the larger module resistances.
If the front panel jacks are properly grounded to the front panel, and the front panel is properly grounded to the system’s rails, then again the power cable will not make any difference. Painted and anodized panels will tend to isolate the jack ground from the panel however, so module grounding at the panel is never guaranteed.
In our testing the patch cables introduce a minimal amount of noise compared to power bus noise, and is more of a spot problem for certain modules or combinations, and occurs at only a few frequencies.
For patch cables the question is open for heavier gauge benefits. Our testing has seen mixed results. When in doubt, try both lighter cables and heavier cables and compare the noise between them. A typical twelve inch patch cable has a ground resistance of 75 milliohms, while a heavier gauge cable such as a Stackable has a ground resistance of about 19 milliohms for the same length. Try both types and multiple lengths to attack a suspected patching noise issue.
How do I build a star power distribution system for a cabinet with many bus boards?
Barrier (Terminal) Strips have been around for decades as the means for making internal cabinet DC power connections. The power source connects to the barrier strip, and then the bus boards connect to barrier strip terminals. This limits common impedance coupling to the wire between the power source and the barrier strip. However, length of wires from the barrier strip to the bus board must also be considered to reduce the noise coupling for each bus board. For a very large cabinet, multiple power sources are be preferable to avoid excessively long power wires.
The LIBB – System Power Wiring Guide contains recommended part numbers for barrier strips and jumpers to build any size cabinet and bus board configuration. It also includes an example wiring diagram with best practices for a low noise system.
Theory
How do modules generate, share and amplify noise?
- Noise generation
- Noise coupling
- Noise pick up or susceptibility
- Noise amplification
Noise generation happens with almost every module. Noise is also generated by any power supply. Any module generating voltage or current swings generates noise on its own power busses. In the 1970s era of modular synthesizers, VCOs, LFOs, clocks, gates or LED drivers would be the main culprits for coupling noise into other modules, generating noise in the sub-audio and audio ranges. In the current modular era added circuits are microcontrollers, FPGAs, DSPs, switching DC-DC converters, alphanumeric LEDs/LCDs, graphics displays and multiplexed LEDs, generating noise in the audio and video ranges.
Borrowing terminology from the engineering field of Signal Integrity, noise generators will also be called “aggressors” in the following material.
Noise is coupled through the system’s shared power bus and through the patch cord connections. More details on the power bus aspects of noise coupling are shown in the Common Impedance Coupling section, as this is a big topic that requires more technical exposition. All power lines share noise: +12V, -12V, +5V and Ground. Yes Ground. The largest portion of noise coupling happens through the ground path, and it cannot just be filtered out.
Patch cord coupled noise has been seen as a small contributor in the tests conducted for these studies, and more of a point issue showing up for a few module combinations rather than across the board noise like the power rail noise. Noise coupling through Electromagnetic Interference (EMI) will not be covered here.
Noise pick up or susceptibility, like noise generation, is specific to each module. A module designed for lowest noise does not use the power bus directly for voltage references. Instead, it generates them locally with on board dedicated voltage references for critically accurate voltages such as for Digital to Analog or Analog to Digital converters, or voltage regulators for general voltage DC offset. Even in this well designed case some of the noise couples into the circuits. Other circuits such as transistor or OTA based VCAs or mixers may exhibit higher noise than op amp or IC based VCAs, which are designed for high Power Supply Rejection Ratios (PSRR), basically the ability of the device to reject power line noise.
Again borrowing Signal Integrity terminology, we’ll call these modules “victims.” A module can be both an aggressor and a victim. For victims you will mostly care about modules that should be silent at some time in their operation. Those modules include mixers, VCAs, attenuators, attenuverters, filters, effects and so forth. For something like a VCO or LFO that puts out 10 volt peak to peak waveform, any small amount of noise coupled into the output is masked by the output signal’s amplitude, so you won’t care on small noise levels there.
Using +12V or -12V directly as a DC offset source in a module design creates a large amount of noise in the module’s signal path, for anything it processes or controls. While that was standard practice in 1970s synthesizer design, most of those synthesizers had a better power distribution method and smaller configurations than contemporary eurorack. Also signal to noise ratio recording fidelity was more limited in the era unless Dolby or DBX was used.
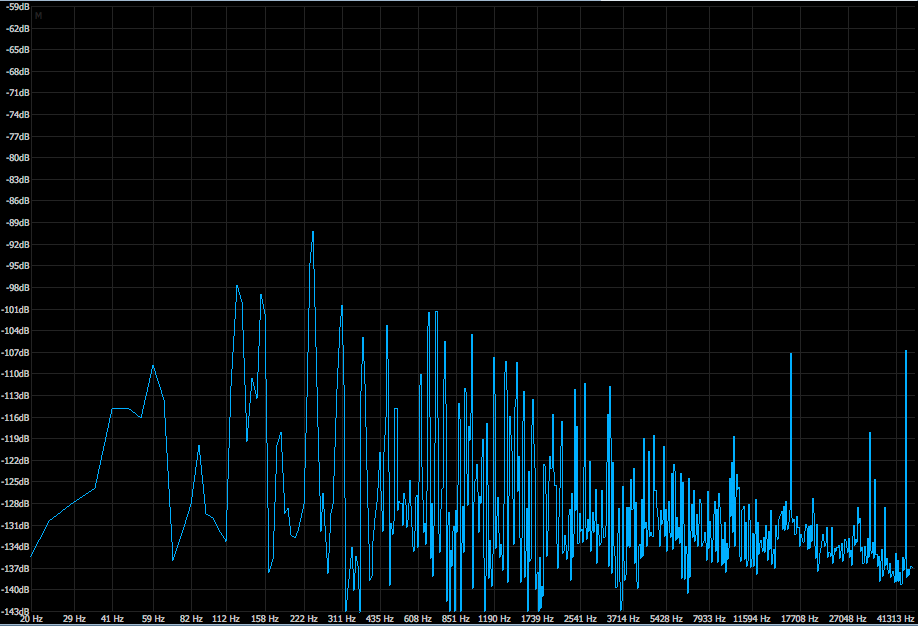
Below is example of noise from a well designed attenuverter and DC offset module (Mutable Instruments Shades), connected through Intellijel Balanced Outs to a MOTU 16A 24 bit 96 KHz recording channel. The eurorack system is powered with a standard light 1 ounce copper eurorack bus board with some added capacitors. Noise peaks are from a linear power supply with 60 Hz plus harmonics, 8 LEDs pulsing in synchronization (240 Hz plus harmonics), plus various other module induced spikes at 1.3 KHz, 16 KHz and other frequencies. None of these modules inducing the noise are connected to the attenuverter/DC offset module or Intellijel output module. The attenuverter knob for the measured channel is zero, so the image is showing the intrinsic noise in that set up. The noise will always be on the output.
Now, if just the DC offset/attenuverter make and model is changed the results become far worse. This offset/attenuverter design uses the power supply voltages directly for DC offset. It also has bulk capacitance at the end of the board, instead of near the power connector and inline with the circuits, resulting in poor local power decoupling. The results are shown in the next image.
That is a huge difference in noise, with peaks going from -96 dB to -70 dB. Let’s call that 1970s recording fidelity, if that. Unfortunately there is no way to detect these issues except by meticulously testing every module in your system. For every attenuator, mixer channel, VCA, VCF or DSP output that can be nulled to zero input, feed it to your DAW and check the noise per module. For a device as noisy as these there are two options, remove it from your system, or get a quieter power distribution system.
In the tests conducted for this white paper, far greater variation has been seen in victims than aggressors. Your system can seem very clean, and then plug in a poorly responding victim module and the noise floor can increase 20 or 30 dB. The module shown above is not rare. It is a 4 hp attenuverter/offset module from a well known eurorack manufacturer, listed in the top 10 on Modular Grid for 4 hp polarizers. You will likely have this module or one with similar noise performance in your system.
- Wavefolders amplify all signal and noise equally, up to 30 times amplification in many cases. For the highest levels of wavefolding, noise becomes a clear component.
- High Q or resonant filters amplify selected frequencies ~10-30 times above normal levels. When you hit the noise frequencies they will be amplified as well, which is particularly noticeable if there are no signal frequencies in that range.
- Feedback through delay or echo also creates a resonance effect and amplifies noise as equally as signal.
- Distortion and saturation are other high gain circuits with noise amplifying potential.
- VCAs with log gain over 0 dB can add significant amplification to an input.
- Microphone and instrument pre-amplifiers can add system noise to your amplified device.
The next experiment takes the 1 ounce copper bus board with the noisy DC offset/attenuverter and puts it through a wavefolder at maximum gain. Here is the result with peaks to -45 dB. While it may seem like a good sound source for a Noise composition, you don’t want this stuff in mixes where nuance and clarity are part of your music. Once this is in your mix, you can’t simply noise print it out in your DAW because it varies with every modulation, processor, mix level or VCA change. For waveshapers a common practice is to put the waveform through a VCA prior to the waveshaper, so that timbral shifts occur with input amplitude. If there is no filtering or VCA stage following the waveshaper, then the amplified noise carries all the way to the audio outputs.
The next experiment takes the 1 ounce copper bus board with the noisy DC offset/attenuverter and puts it through a wavefolder at maximum gain. Here is the result with peaks to -45 dB. While it may seem like a good sound source for a Noise composition, you don’t want this stuff in mixes where nuance and clarity are part of your music. Once this is in your mix, you can’t simply noise print it out in your DAW because it varies with every modulation, processor, mix level or VCA change. For waveshapers a common practice is to put the waveform through a VCA prior to the waveshaper, so that timbral shifts occur with input amplitude. If there is no filtering or VCA stage following the waveshaper, then the amplified noise carries all the way to the audio outputs.
All of these variables conspire to make noise control seem virtually impossible in a modular system. But with the Genus Modu Low Impedance Bus Board the noise coupling across modules is reduced significantly, breaking the chain between noise generation and noise susceptibility and amplification. The section and video on Common Impedance Coupling is important for understanding how that happens.
What is common impedance coupling?
How is noise coupled across modules?
In a perfect world, the power lines from the power supply and through the bus board would be zero, but that is never true, there is always some resistance over any conductor. Common impedance coupling is the situation where modules sharing the same power lines have signals leaking between them because the resistance of the bus is never zero.
The impedance of the power distribution varies based on the thickness of the wires or the thickness and width of the copper on printed circuit board. For simplified modeling only the resistance can be used, eliminating the frequency dependent effects of inductance. Bus distribution resistances are measured in fractions of an ohm, in milliohms - thousandths of an ohm.
Noise is coupled across modules through the common impedances of the power lines. The following YouTube video illustrates noise coupling or leakage through the common impedance path in a eurorack power system, through a simulation using Labcenter’s Proteus ISIS PCB Design and Advanced Simulation program. The information is very technical so repeated viewings may be needed.
The Genus Modu LIBB attacks common impedance coupling through the lowest ground path resistance of any eurorack bus board.
One of the best references for the connection and noise topic is Chapter 36 of the book "Handbook for Sound Engineers, 5th Edition", edited Glen Ballou. A version of this information also appears in Chapter 7 of the book “Audio Engineering Explained”, edited by Douglas Self. The chapter, written by Bill Whitlock, is titled “Ground and Interfacing” and covers basic engineering theory and practice for noise, grounding and cable impedance. The standard engineering reference on noise control is the book “Electromagnetic Compatibility Engineering” by Henry W. Ott.
What is ESR, |Z|, |Z| vs. Frequency and PDN?
How is capacitance effectively used in bus board power distribution?
In order for power decoupling capacitors to be effective, the design must have the lowest impedance path to those capacitors. For the frequencies seen in a eurorack system, the capacitance effectiveness is mainly controlled by resistance to the capacitor, measured in milliohms, or 1000ths of ohms.
All capacitors on LIBB are selected for low ESR, or Equivalent Series Resistance. ESR is the internal resistance of the capacitor from its leads to internal bonding and the capacitive elements. The Equivalent Series Resistance is inside the capacitor. ESR in LIBB surface mount caps is as low as 3 milliohm and as large as 117 milliohm for the through hole 220 uF electrolytic caps. The larger electrolytic ESR is specifically chosen to avoid a resonant peak in the 3 to 8 KHz region of the audio band.
A typical through hole part has high ESR of 1-3 ohms in resistance and limits the filtering effectiveness of the capacitor. The capacitor simply can’t do its job very well with those resistances. This is also true for small value ceramic capacitors in through hole packages. ESR is never specified for those parts.
The other important aspect is having a low resistance between the noise sources or aggressors, power supplies and modules, and the noise receptors or victims, all modules. This is accomplished with the ultra low resistance of LIBB, less than 1.5 milliohm for +12V and -12V rails, and less than 0.4 milliohm (400 micro-ohms) for ground. Those are worse case numbers and many connections will see lower resistances. The path resistance is actually much less to each capacitor as they are distributed across the board. LIBB uses some other techniques from modern designs, such as dual short traces from capacitor pads to vias for lowest resistance and inductance.
Other current eurorack bus boards fall short in effectively using capacitance. Through hole capacitors below 40 uF are not very good at decoupling; they must be surface mount for lowest ESR. Larger electrolytic capacitors cannot be randomly chosen from the cheapest source. A typical non-ESR specified capacitor has 1-3 ohms of resistance just from its leads and packaging. Then add the high series resistance of ground and power traces and the result is capacitors that filter noise poorly. Just a visual inspection of a bus board can reveal the weaknesses of the design. If you see small through hole capacitors on the board, then it is not filtering very well.
The charts below have the Y-axis in a decibel scale, showing LIBB in blue and by far the best at filtering power bus noise. The orange curve is for a 1 ounce copper bus board with through hole capacitors. For the filtered bus board there are filter dips in high frequencies 20 MHz and 300 MHz that are too high to care about. The flying bus cable and 4 ounce copper bus board in yellow and red respectively don’t do any filtering. The lower frequency roll off is from the power supply source impedance and regulator loop response combined with the cable and bus board resistance.
While in the ideal world each eurorack module would provide all the filtering it needs, that is more difficult than it sounds. Most module decoupling is picked arbitrarily based on “best practices.” The number one design mistake is to underestimate the amount of capacitance needed for proper filtering at a given frequency. The smallest capacitor used on LIBB is 1 uF because anything smaller than that is not going to work at useful frequencies. Also, to filter a power bus below 1 KHz requires thousands of uF of capacitance, which will prevent most power supplies form starting up. LIBB has jumper options for the secondary bulk capacitors, so users can customize the bus board to their power supply capabilities. Under normal use the jumpers add less than 20 milliohms of resistance in addition to the 117 milliohm bulk capacitor resistance.
|Z| is Impedance, or resistance plus reactance. Resistance has no frequency dependency and is the value for DC voltage. Reactance is the frequency dependent component of impedance, composed of both capacitance and inductance. It is the reactance element of the design that makes the impedance vary over frequency. It is similar in concept to a filter response chart, but with impedance on the vertical y axis instead of amplitude.
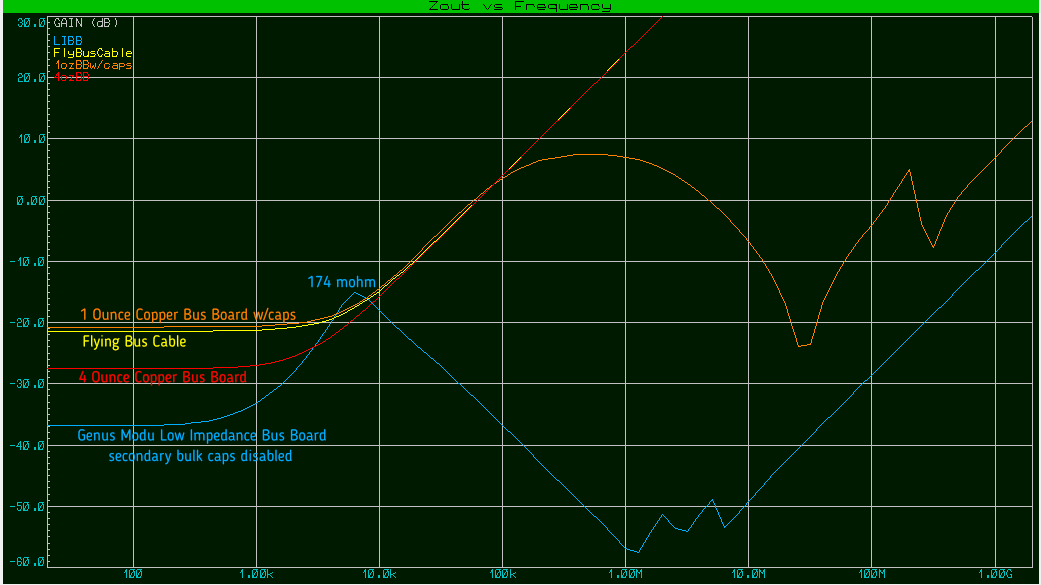
The first chart of Zout (Impedance) vs. Frequency shows a 12 Volt rail with both secondary caps enabled, jumpers on. The second chart shows a 12 Volt rail with both secondary caps disabled, jumpers off. In each case LIBB is clearly superior in filtering noise from the high audio and into the full video frequency range. The common flying bus cable and bus board without capacitors provide no filtering at all. Only the Genus Modu LIBB effectively filters the higher frequencies up to 6 MHz where analog video synthesis resides.
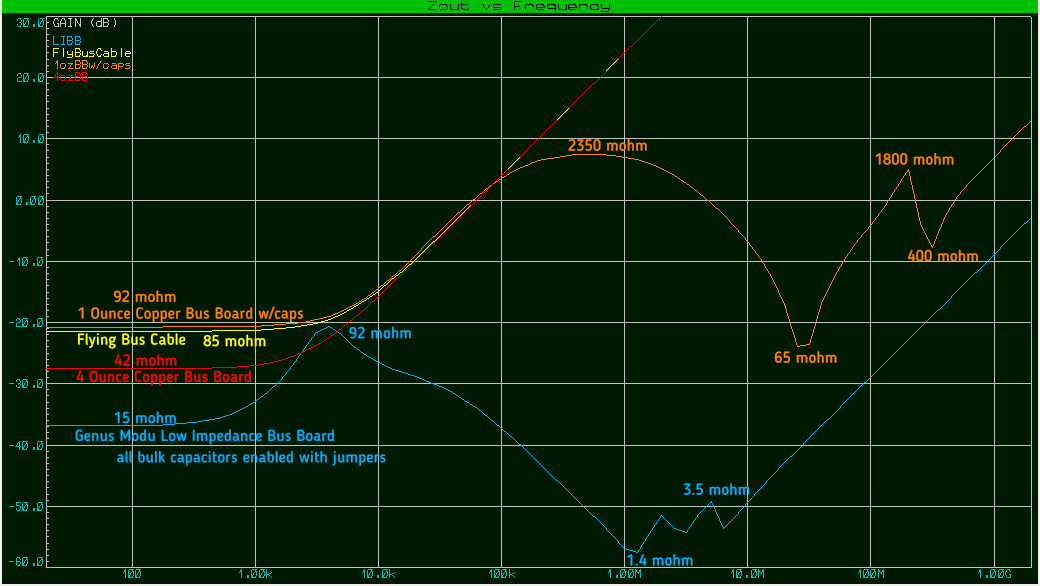
The peak seen at about 4 KHz is due to the interaction of the power supply output impedance, the cable and connector impedances, and the limits of capacitance on the bus. It would take thousands of microFarads to remove the peak, and then no one's power supply would start up. Notice that all of the other curves just keep going up right past the 4 KHz point. The peak for LIBB at 4 KHz is about 92 mohm with all capacitors enabled. Careful selection of the capacitor is required here. If ESR is too high then the big caps are not effective, if the ESR is too small then the peak goes up to many ohms on the chart, creating a resonant point for noise amplification. If capacitor values are not matched well, then that also creates resonant peaks. In the second chart the removal of the capacitors has a small impact on the frequency and amplitude of the peak.
The Low Impedance Bus Board design uses Power Integrity engineering techniques including simulation to get to the lowest noise solution. Nearly all modern electronics uses this technique, from your cell phone, to your computer and data center servers. The |Z| (Impedance) vs. Frequency chart is a tool used in Power Delivery Network (PDN) analysis to insure that the entire system is providing clean power across the frequency spectrum to the end devices. This same principal has now been applied to eurorack power distribution for the lowest possible noise solution.
Copyright © 2018 Genus Modu LLC